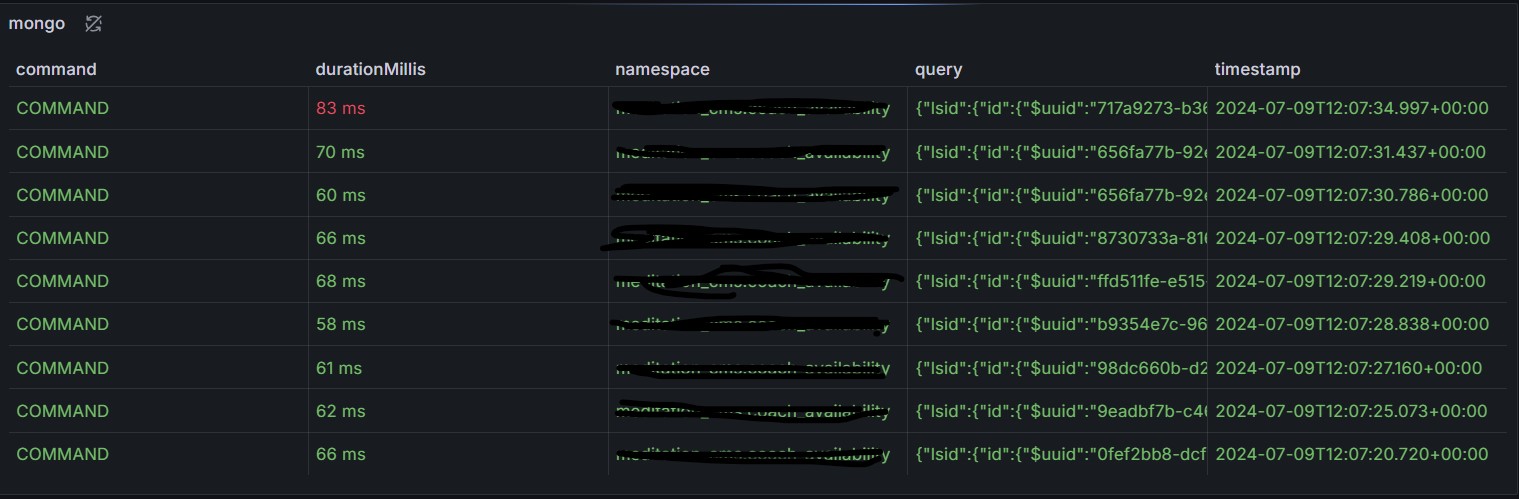
Mongo Slow Query
This dashboard picks up the logs for ELK and uploads them into Grafana, creating a dashboard for slow queries.
Slow query logs enable in Mongodb
// per database
use db_name
db.getProfilingStatus();
db.setProfilingLevel(2, { slowms: 100 });
Logstash Configuration
Replace the password value with the Elasticsearch password.
input {
beats {
port => 5044
}
}
filter {
if [log_type] == "mongo" {
json {
source => "message"
}
if [msg] == "Slow query" {
mutate {
add_field => {
"timestamp" => "%{[t][$date]}"
"command" => "%{[c]}"
"namespace" => "%{[attr][ns]}"
"durationMillis" => "%{[attr][durationMillis]}"
"query" => "%{[attr][command]}"
}
remove_field => ["t", "attr", "host", "tags", "agent", "ecs", "log", "input", "stream"]
}
} else {
drop { }
}
}
}
output {
if [log_type] == "mongo" {
elasticsearch {
hosts => ["http://es:9200"]
user => "elastic"
password => "Password"
index => "mongo-logs"
}
}
else {
elasticsearch {
hosts => ["http://es:9200"]
user => "elastic"
password => "Password"
index => "other-logs"
}
}
}
Filebeat Configuration
Replace the LOGSTASH_IP value with the Logstash server IP.
filebeat.inputs:
  - type: log
    enabled: true
    paths:
      - /var/log/mongodb/*.log
    fields:
      log_type: mongo
    fields_under_root: true
output.logstash:
hosts: ["LOGSTASH_IP:5044"]
Data source config
Collector config:
Upload an updated version of an exported dashboard.json file from Grafana
| Revision | Description | Created | |
|---|---|---|---|
| Download |