ZFS
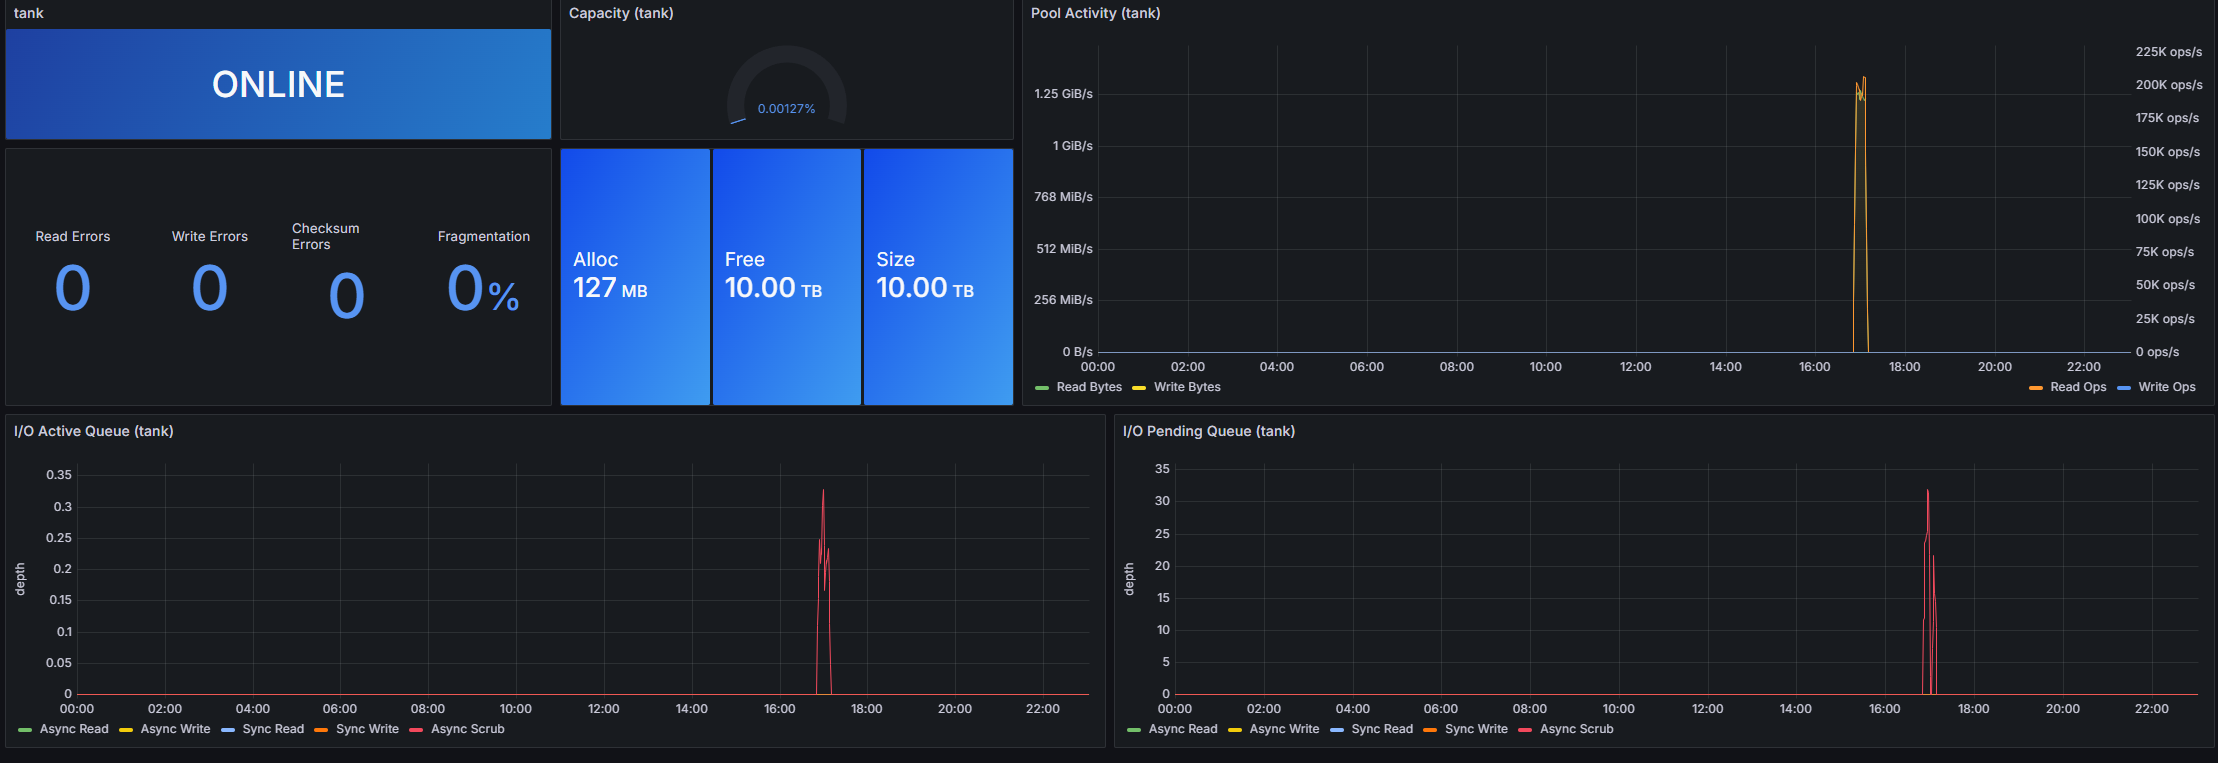
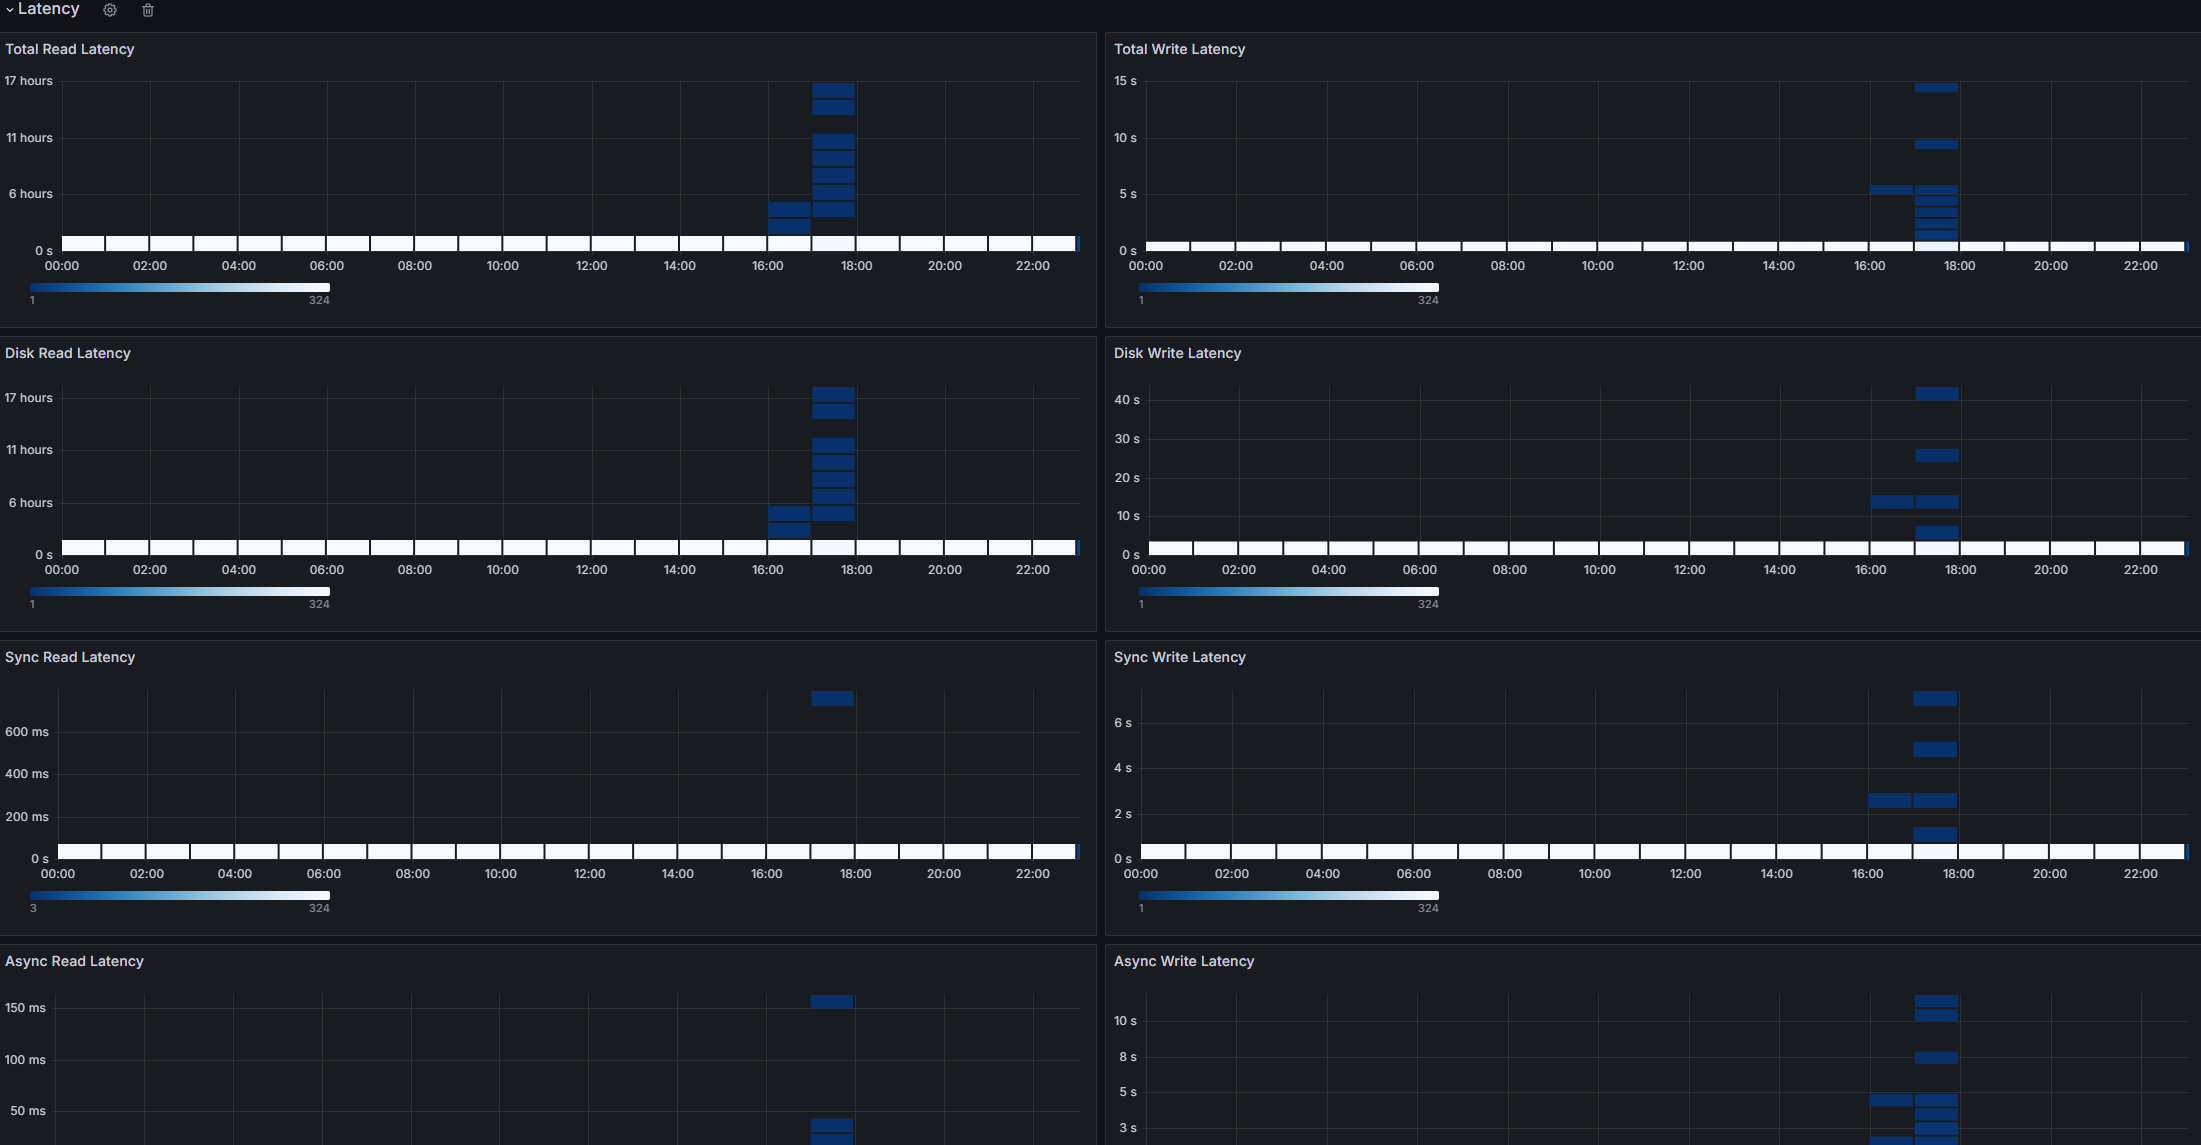
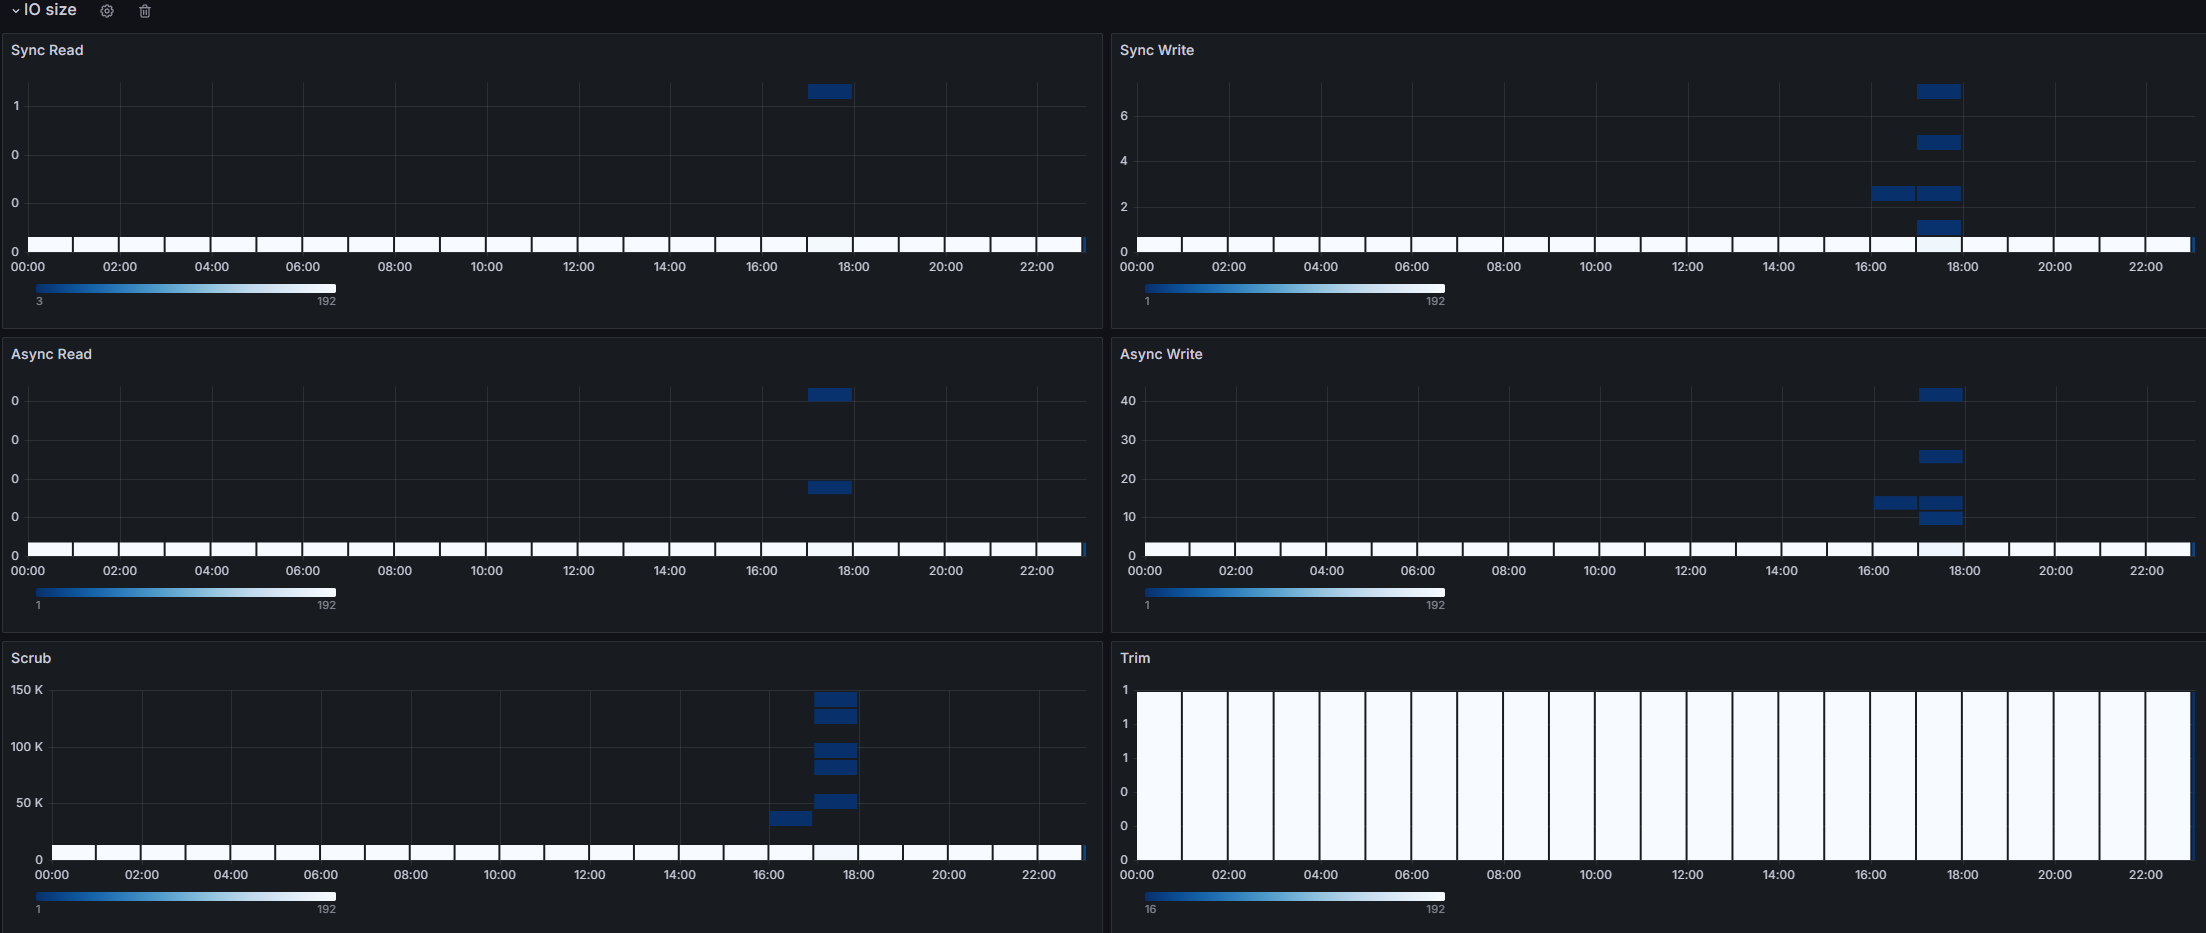
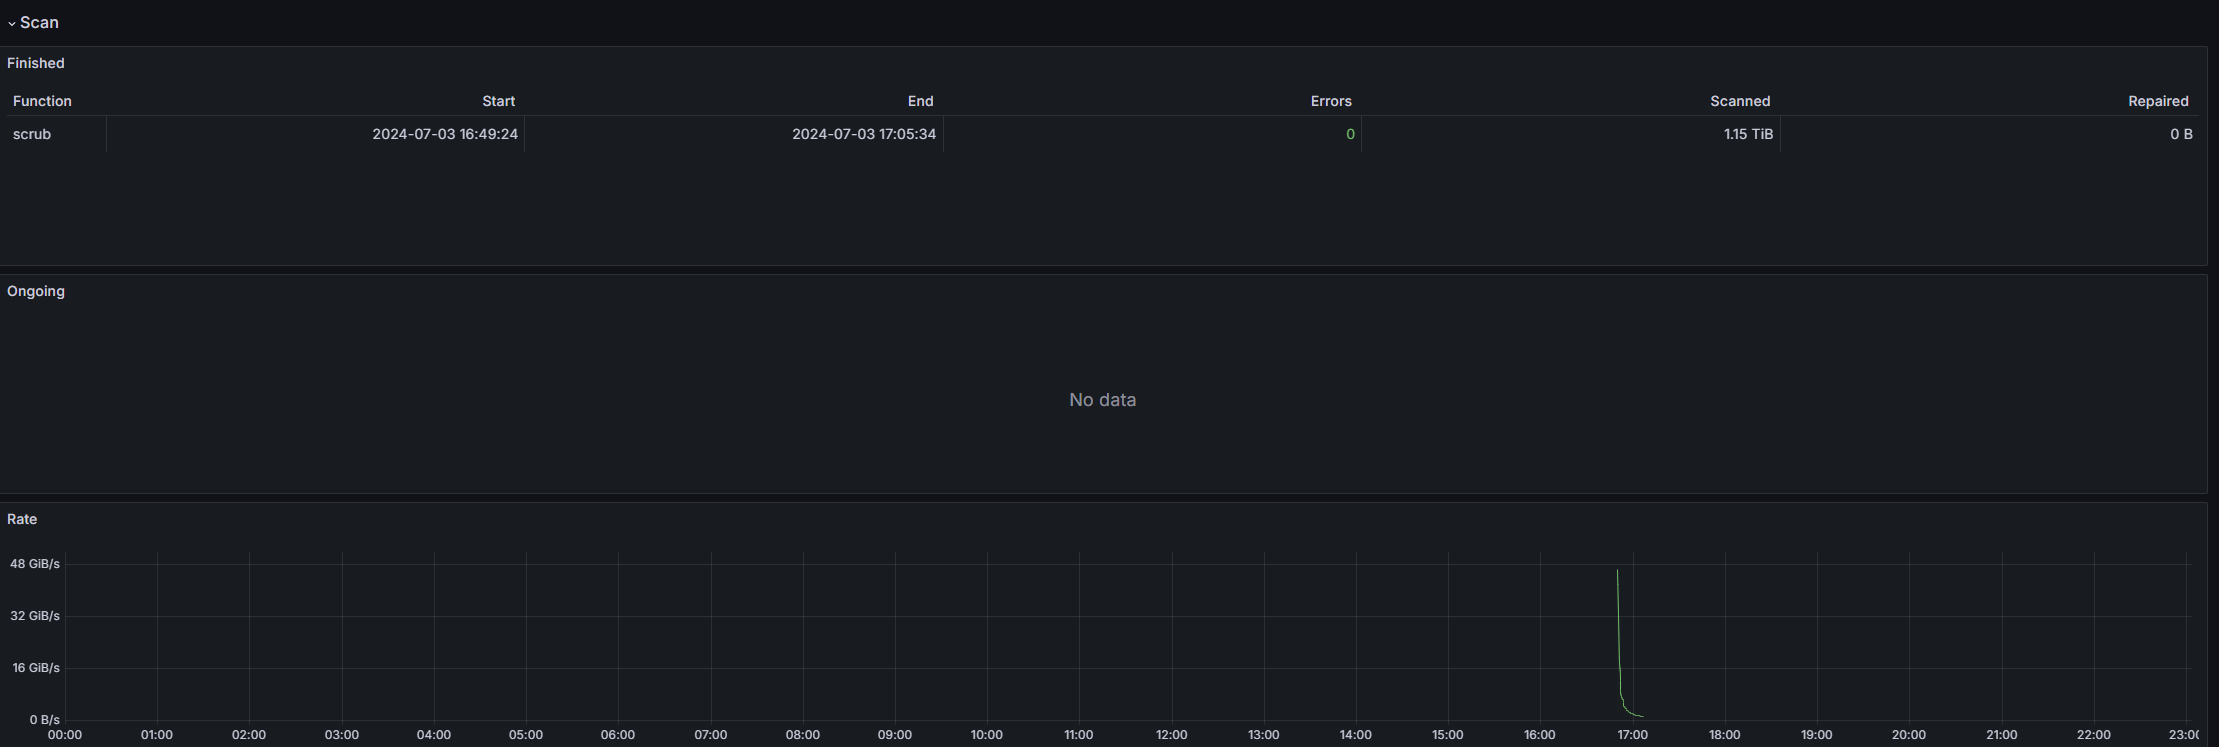
A ZFS dashboard with simple metrics including capacity, pool activity, IO size, latency and etc.
The metrics is collected by using telegraf, serve an endpoint which later scraped by prometheus.
Data source config
Collector type:
Collector plugins:
Collector config:
Revisions
Upload an updated version of an exported dashboard.json file from Grafana
| Revision | Description | Created | |
|---|---|---|---|
| Download |