z/VM Linux Guest Detail
The dashboard provides detailed performance data for a single z/VM® Linux guest with a focus on resource consumption and resource sharing.
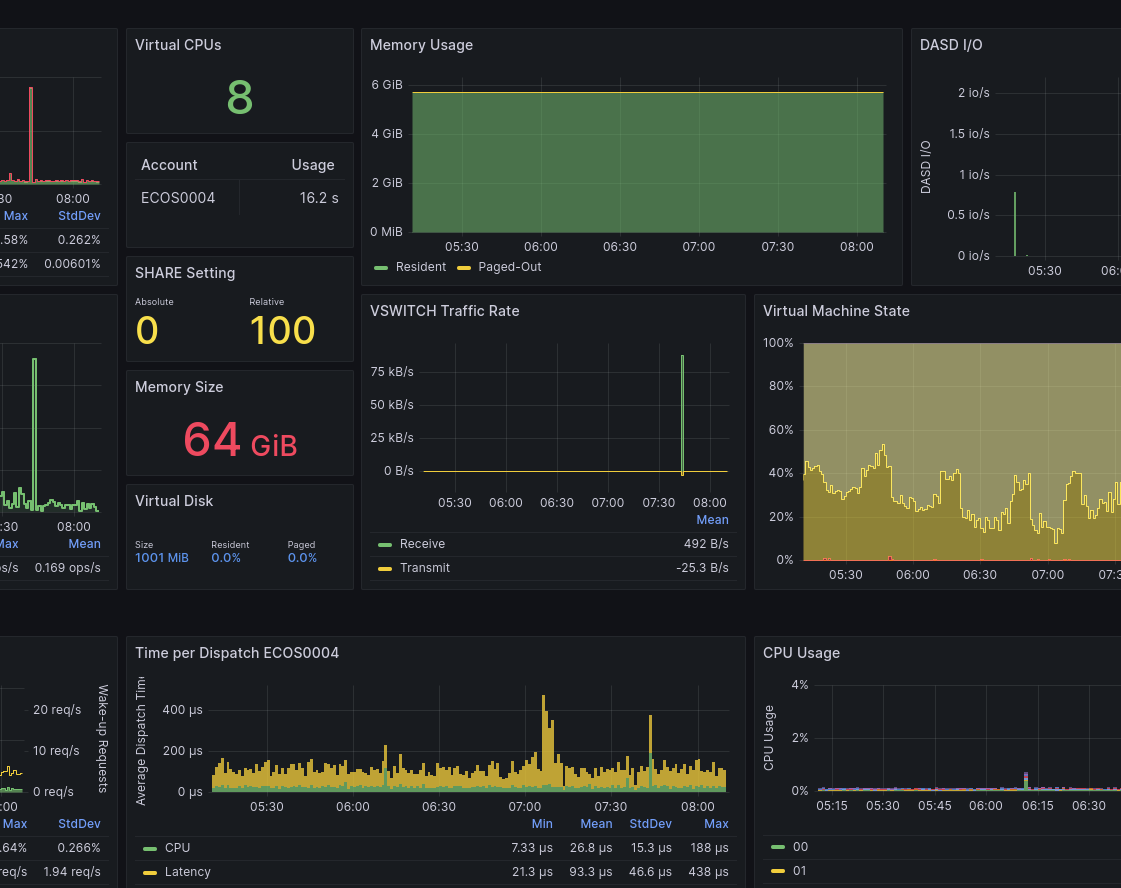
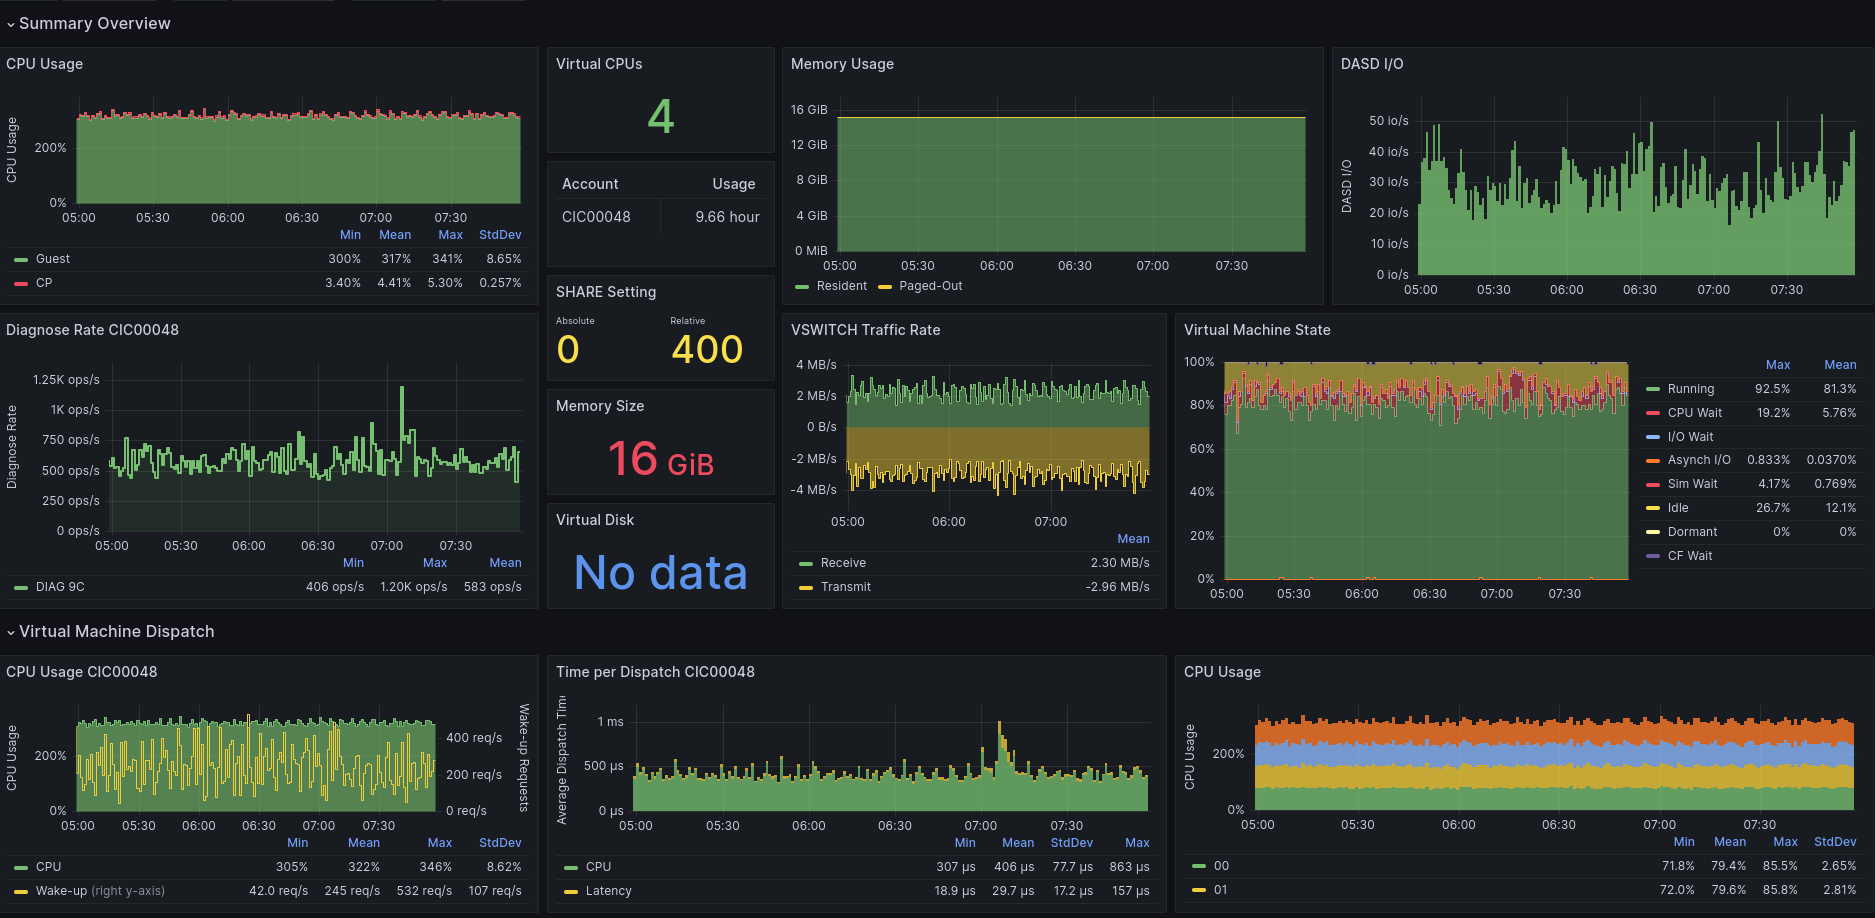
The dashboard provides detailed performance data for a single z/VM® Linux guest with a focus on resource consumption and resource sharing. The information is most relevant for larger Linux guest with several virtual CPUs.
The top rows of the dashboard present metrics that apply to the entire virtual machine, like the total CPU usage over time split in Guest usage and CP service time, resident and paged-out memory of the guest, ECKD DASD I/O rates, and Network traffic through Virtual Switch. For easy reference, panels show the number of virtual CPUs, SHARE setting, and memory size. For Linux guests with multiple virtual CPUs, the panel with DIAG 9C provides an indication of spinlock contention in the application. The virtual machine state panel is a high-level display showing whether the guest is waiting for CPU resources.
The row with Virtual Machine Dispatch panels shows the combination of resource consumption and latency, which helps understand whether the Linux guest receives resources in a timely manner.
The bottom rows show various metrics by virtual CPU (as selected by the pull-down menu). This amount of detail is mostly interesting when virtual CPUs are set online and offline dynamically over time.
For those who prefer a diverging (positive/negative) axis view, you can invert one metric—such as transmit traffic—by adding a negative sign in the query (for example, multiply the value by -1). This allows receive and transmit values to appear on opposite sides of the axis, recreating the traditional split-visualization style.
This dashboard is licensed by IBM under the Apache 2.0 License and is provided ‘as is’ without warranty, representation, support, maintenance or an obligation to issue updates.
Data source config
Collector config:
Upload an updated version of an exported dashboard.json file from Grafana
| Revision | Description | Created | |
|---|---|---|---|
| Download |
Linux Server
Monitor Linux with Grafana. Easily monitor your Linux deployment with Grafana Cloud's out-of-the-box monitoring solution.
Learn more