Contour Global Metrics
A Dashboard that monitors general statistics for Contour Ingress Controller (Projectcontour)
Overview
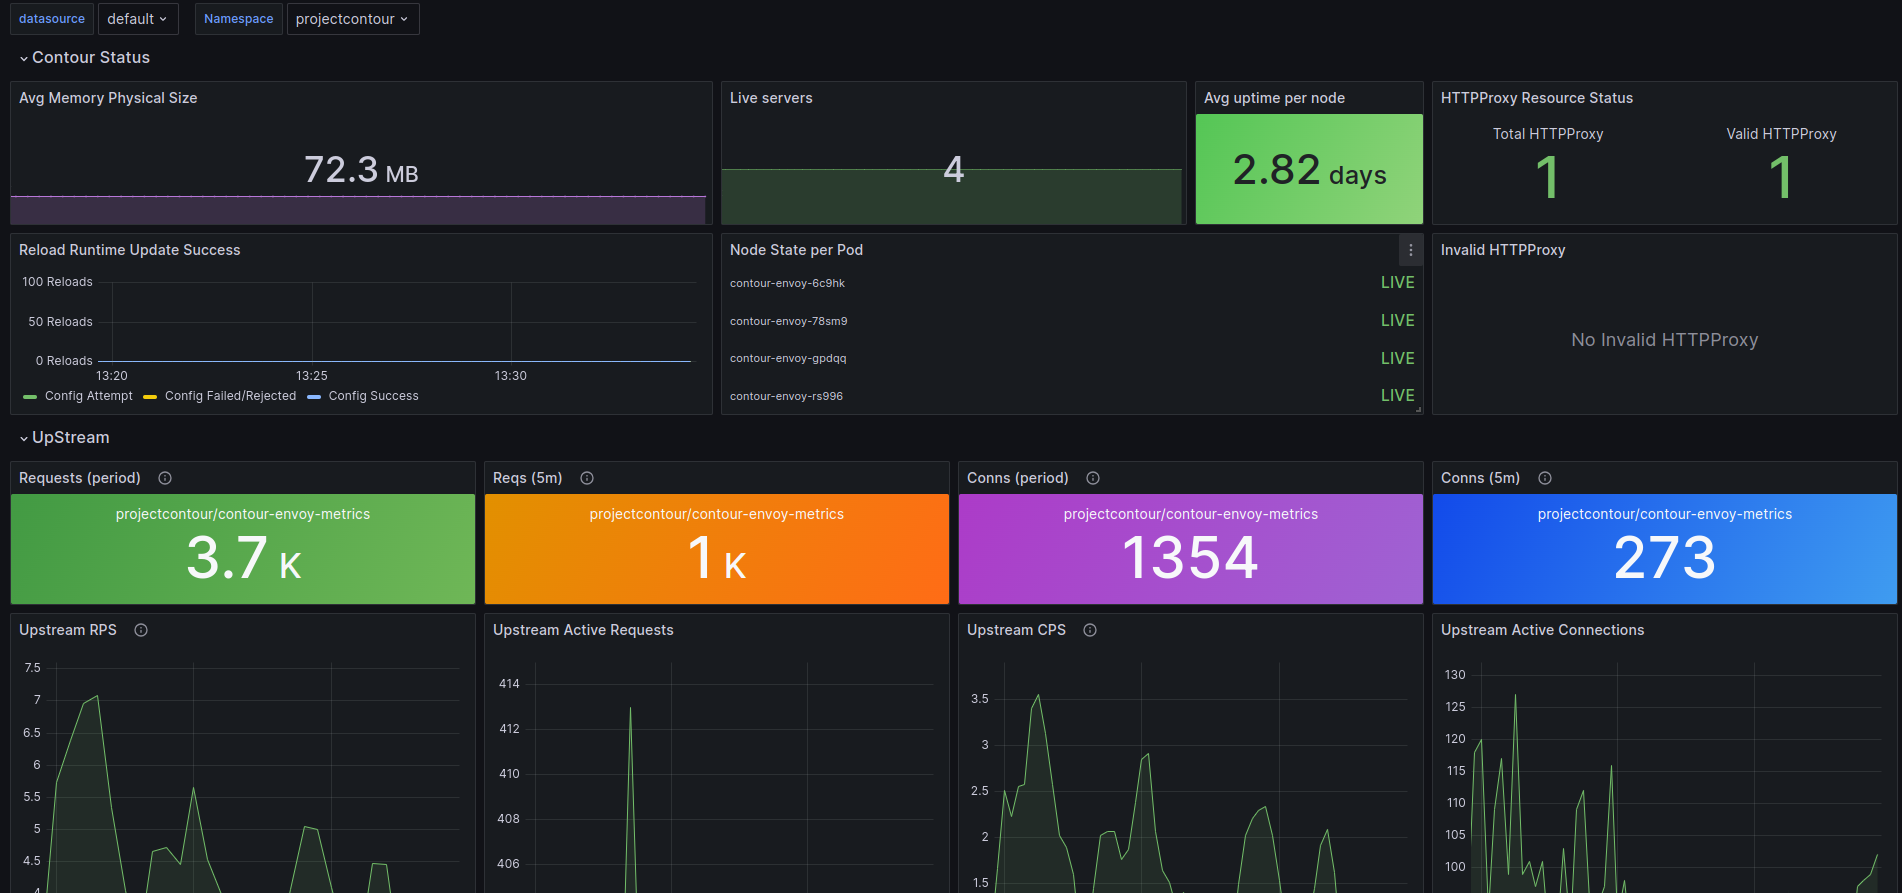
This Grafana dashboard monitors upstream services managed by Contour and Envoy. It displays real-time metrics for requests, connections, memory usage, and node status to help maintain and optimize performance.
Features
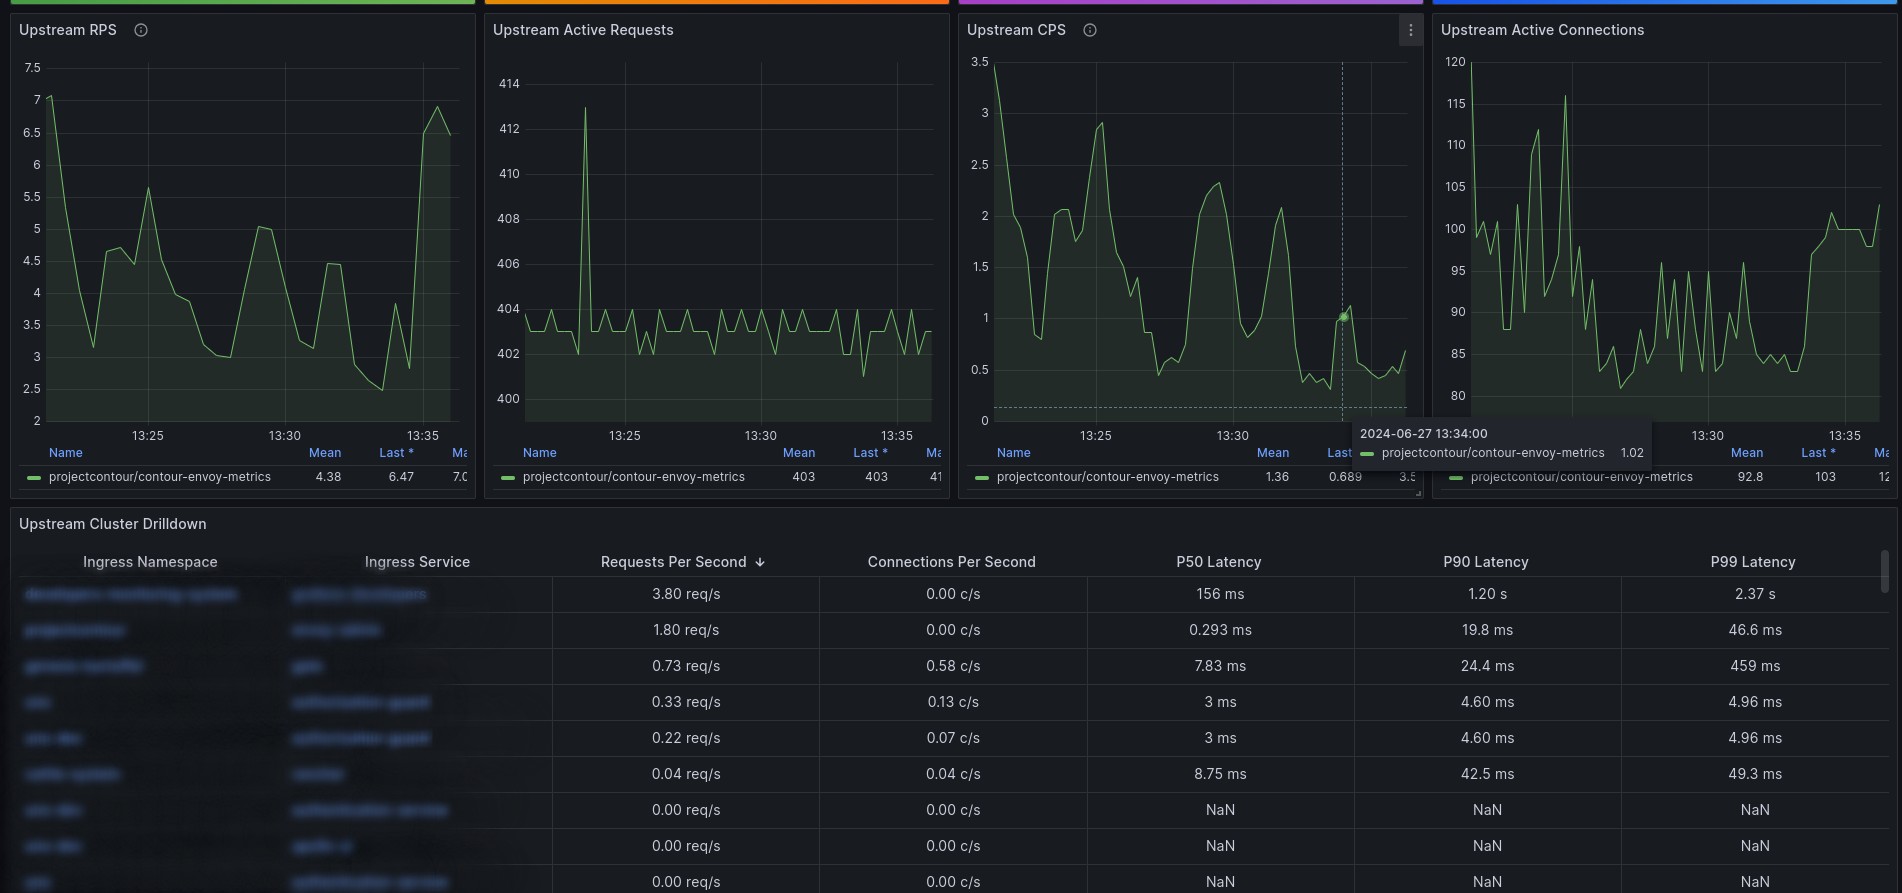
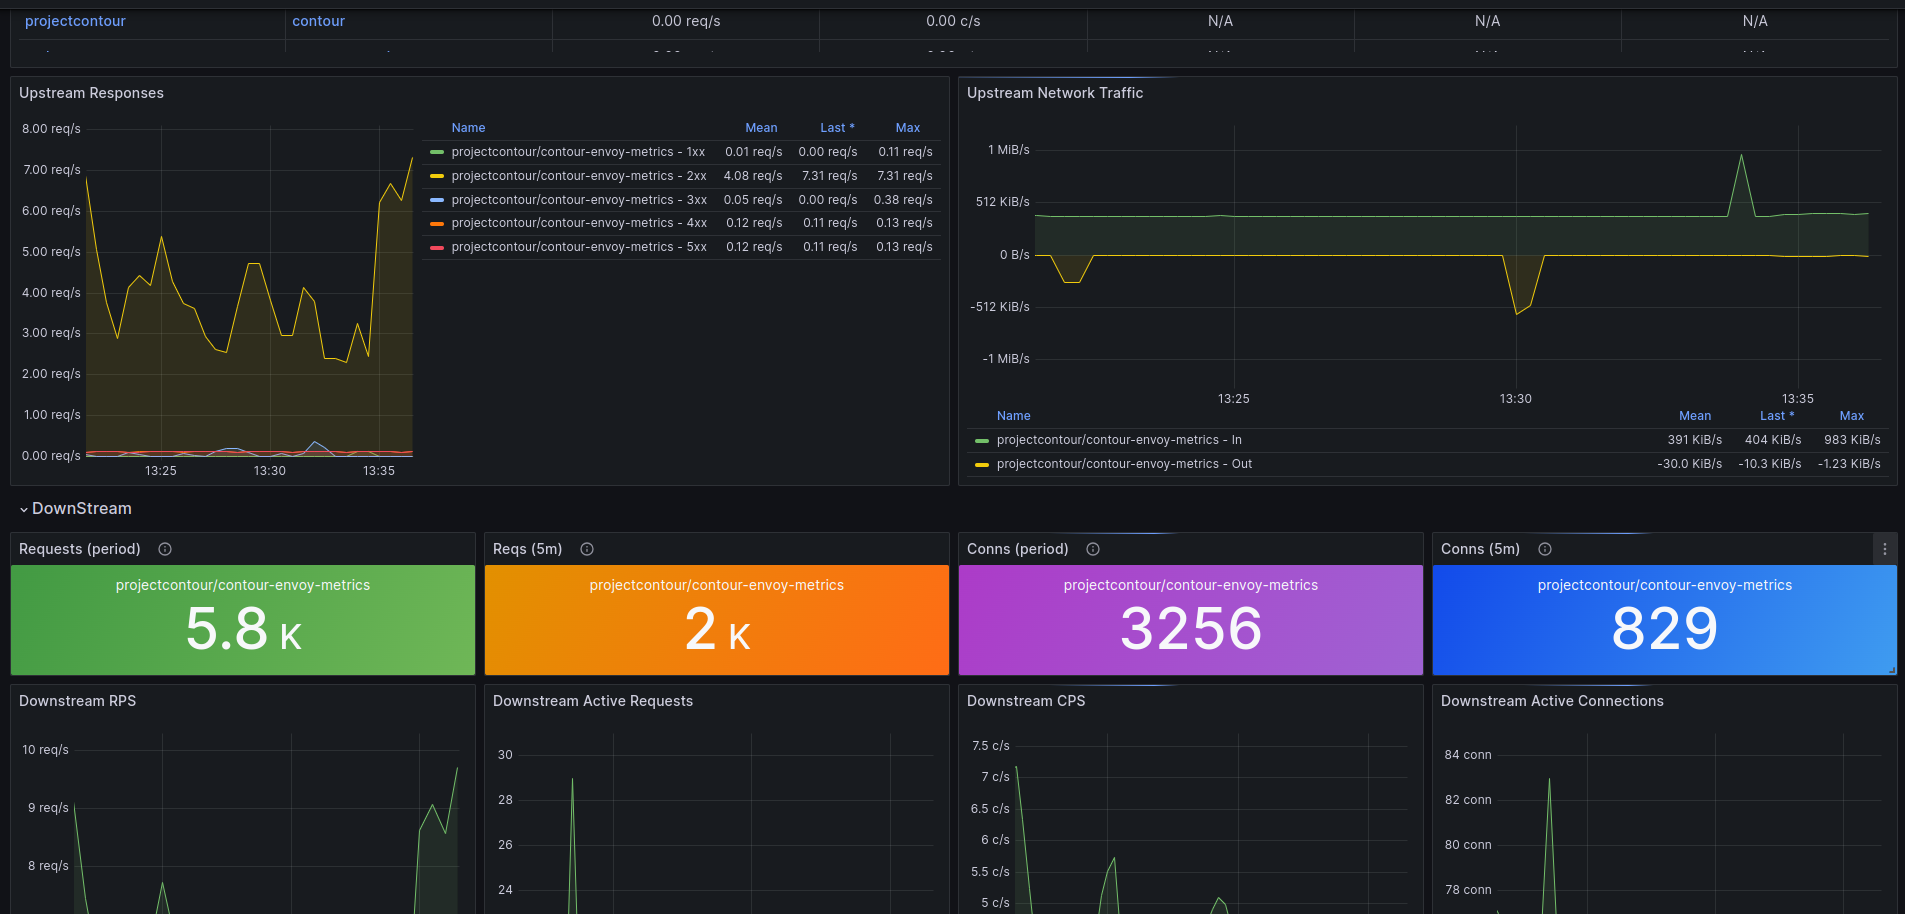
- Requests Per Second (RPS)
- Active Requests
- Connections Per Second (CPS)
- Active Connections
- Memory Usage
- Node Status
- HTTPProxy Resource Status
Data source config
Collector type:
Collector plugins:
Collector config:
Revisions
Upload an updated version of an exported dashboard.json file from Grafana
| Revision | Description | Created | |
|---|---|---|---|
| Download |