Contour Ingress Metrics
Contour Ingress Metrics Dashboard
Overview
This Grafana dashboard comprehensively monitors the Project Contour Ingress Controller at the service level, offering a detailed view of various service-level statistics. The dashboard is designed to help you understand the performance, availability, and overall health of your ingress resources.
Dashboard Sections
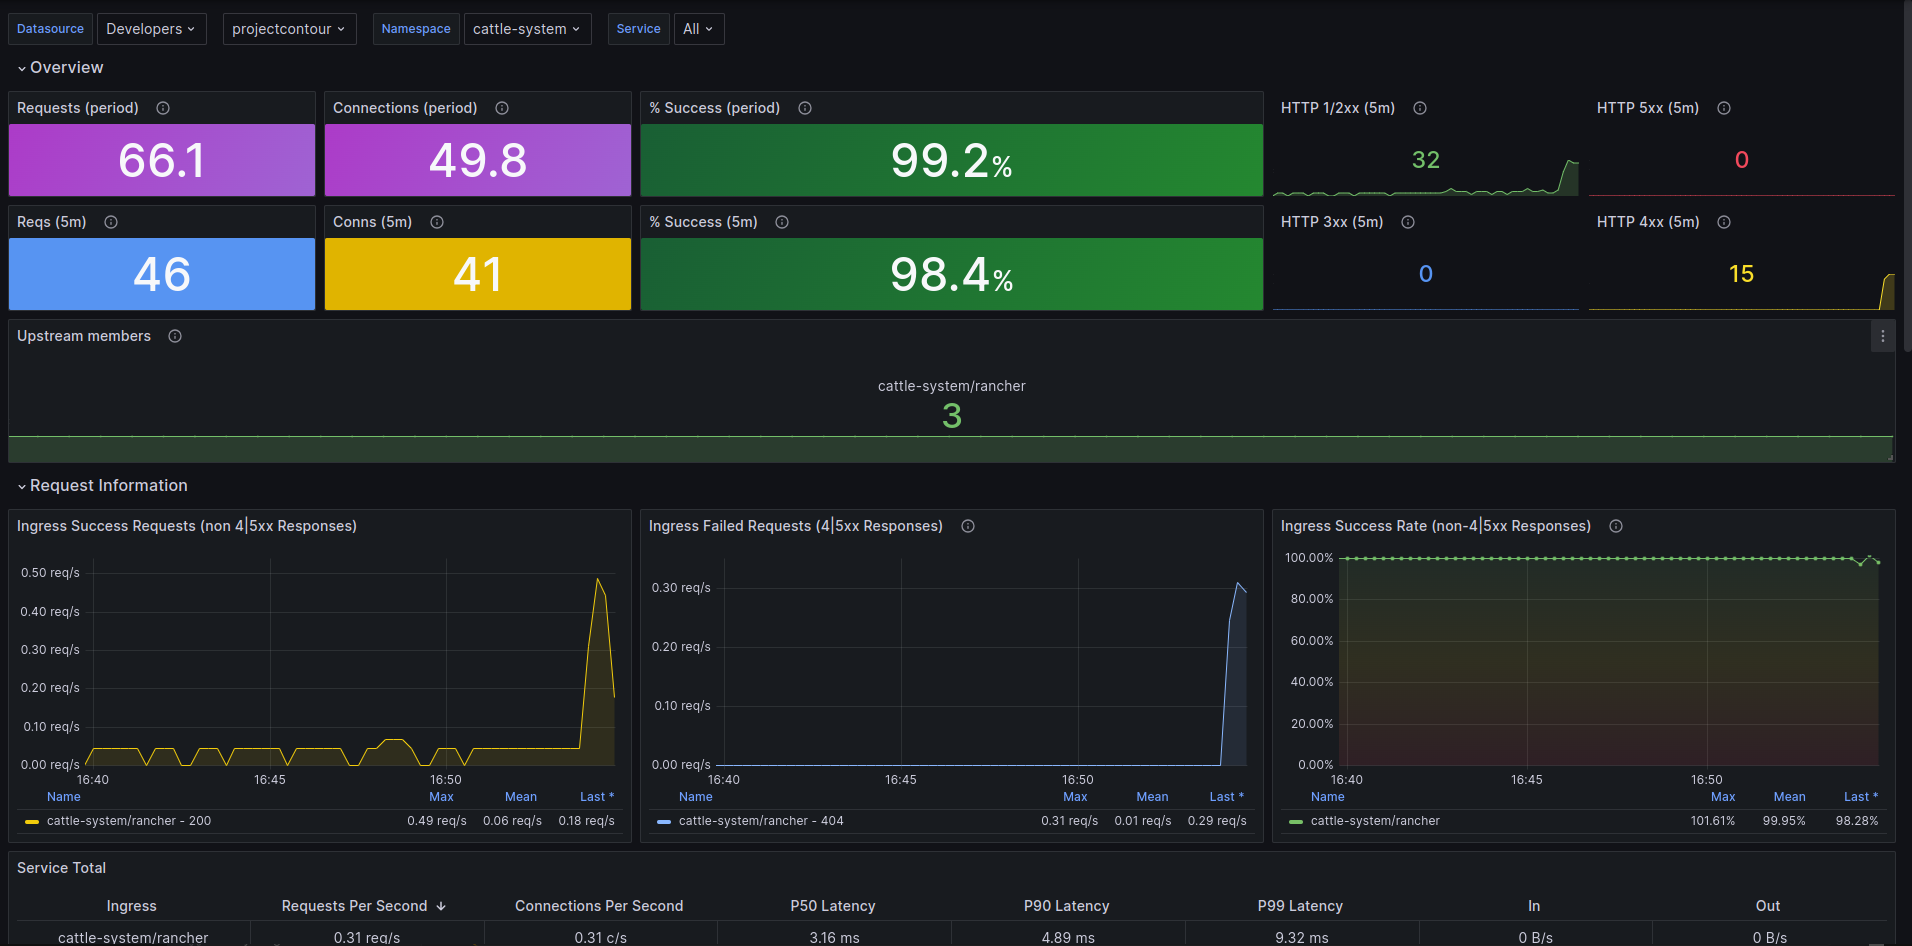
1. Overview
- Requests (period): Displays the total number of ingress requests over a specific period.
- Connections (period): Shows the total number of active connections during the period.
- % Success (period): Percentage of successful requests over the period.
- Requests (5m): Number of requests received in the last 5 minutes.
- Connections (5m): Number of connections in the last 5 minutes.
- % Success (5m): Success rate of requests in the last 5 minutes.
- HTTP Status Codes (5m): Breakdown of HTTP status codes (1xx, 2xx, 3xx, 4xx, 5xx) for the last 5 minutes.
2. Request Information
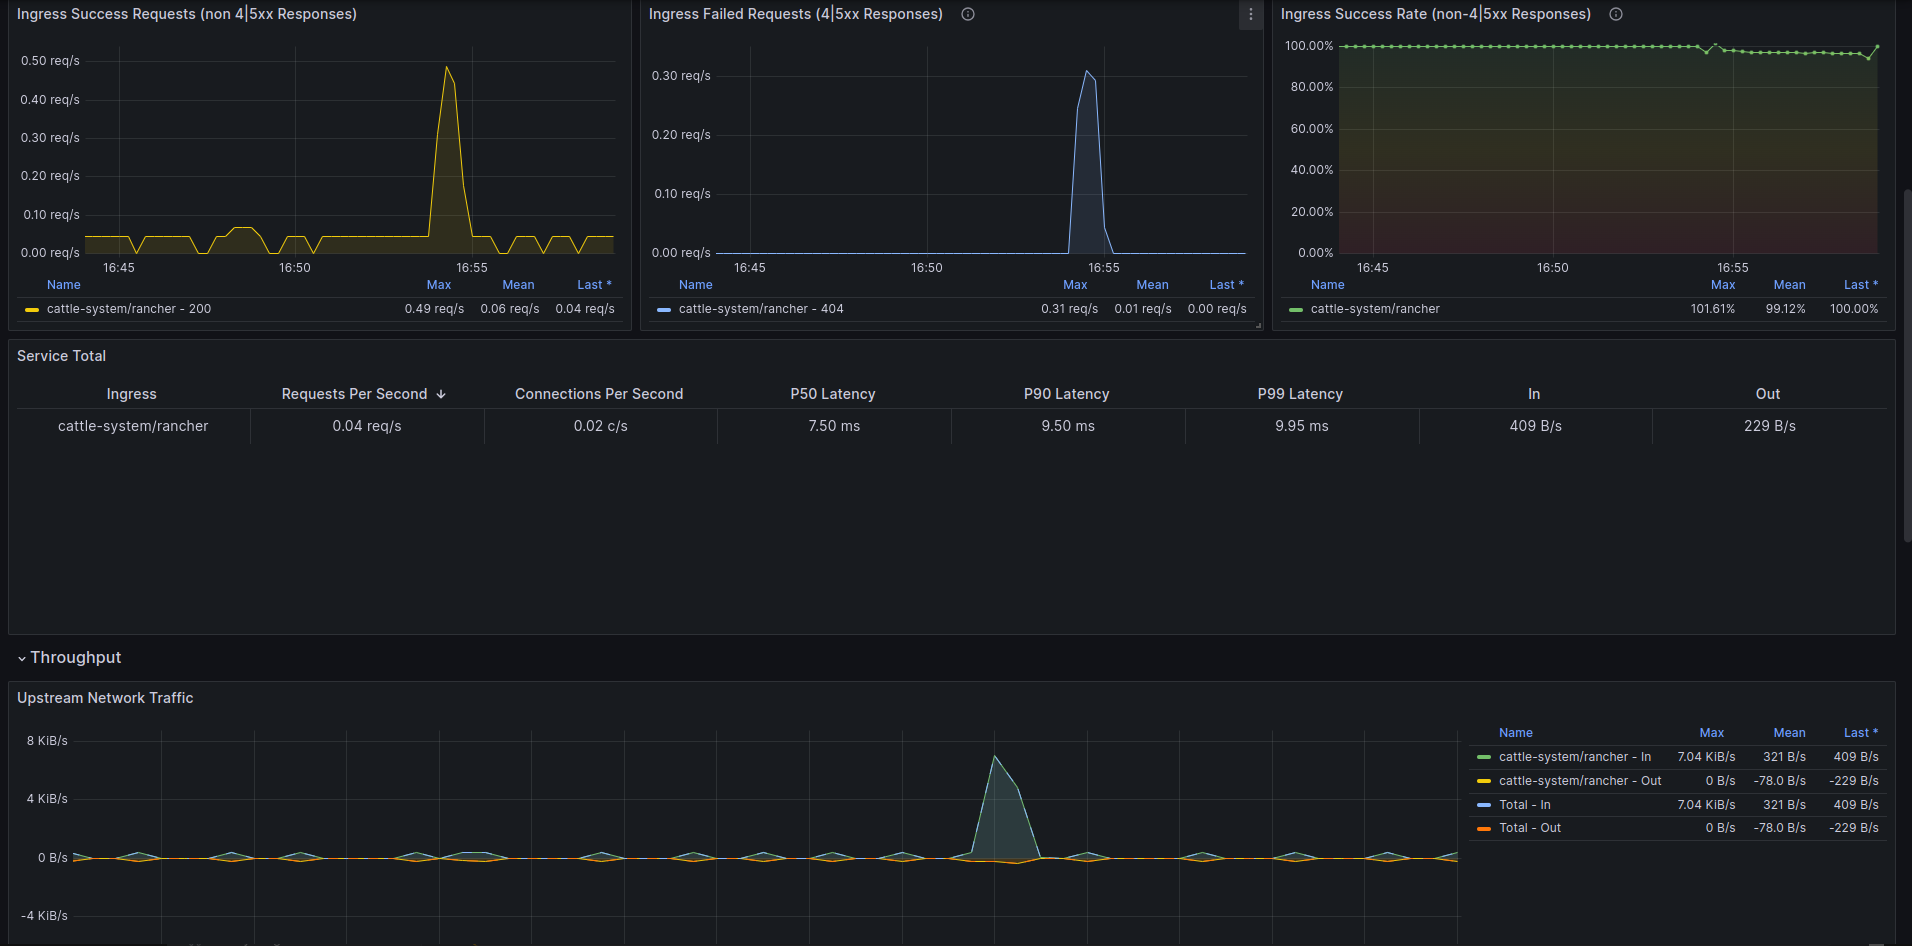
- Ingress Success Requests (non 4|5xx Responses): Rate of successful ingress requests.
- Ingress Failed Requests (4|5xx Responses): Rate of failed ingress requests.
- Ingress Success Rate (non-4|5xx Responses): Success rate of ingress requests excluding 4xx and 5xx responses.
3. Service Summary
- Ingress: Overall ingress metrics.
- Requests Per Second: Rate of incoming requests per second.
- Connections Per Second: Rate of active connections per second.
- Latency (P50, P90, P99): Latency metrics at 50th, 90th, and 99th percentiles.
4. Throughput
- Upstream Network Traffic: Network traffic to upstream services.
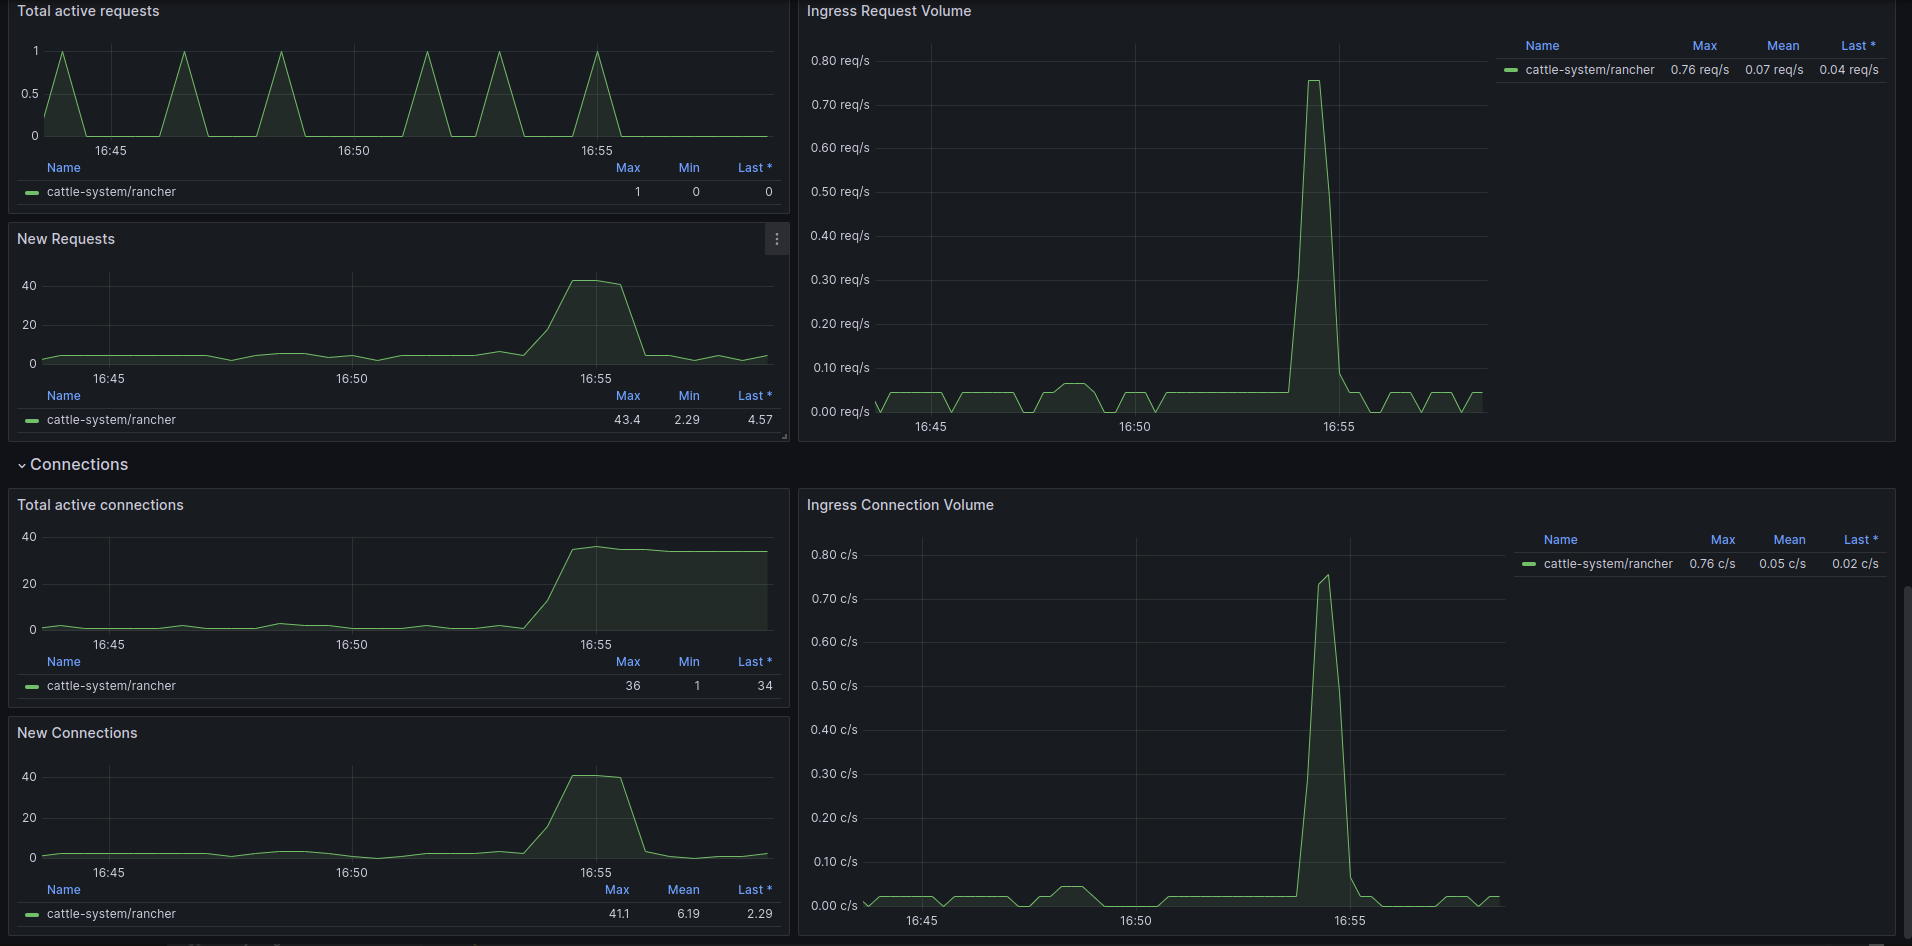
5. Requests
- Total Active Requests: Current active requests being processed.
- New Requests: Rate of new requests coming in.
- Ingress Request Volume: Volume of ingress requests over time.
6. Connections
- Total Active Connections: Number of active connections.
- New Connections: Rate of new connections being established.
- Ingress Connection Volume: Volume of connections over time.
How to Use
- Enable metrics in contour
- Select the correct data-source :)
Data source config
Collector type:
Collector plugins:
Collector config:
Revisions
Upload an updated version of an exported dashboard.json file from Grafana
| Revision | Description | Created | |
|---|---|---|---|
| Download |