Spring Boot Http (3.x)
This dashboard provides real-time monitoring of HTTP requests in a Spring Boot application. It uses Spring Boot Actuator to expose metrics, Prometheus for data collection, and Grafana for visualization.
Introduction
This dashboard is designed to monitor the state and performance of HTTP requests in a Spring Boot application. It uses Spring Boot Actuator to expose metrics and Prometheus to collect and store these metrics. Grafana is then used to visualize the collected data, providing insights into the HTTP request behavior.
Panels Overview
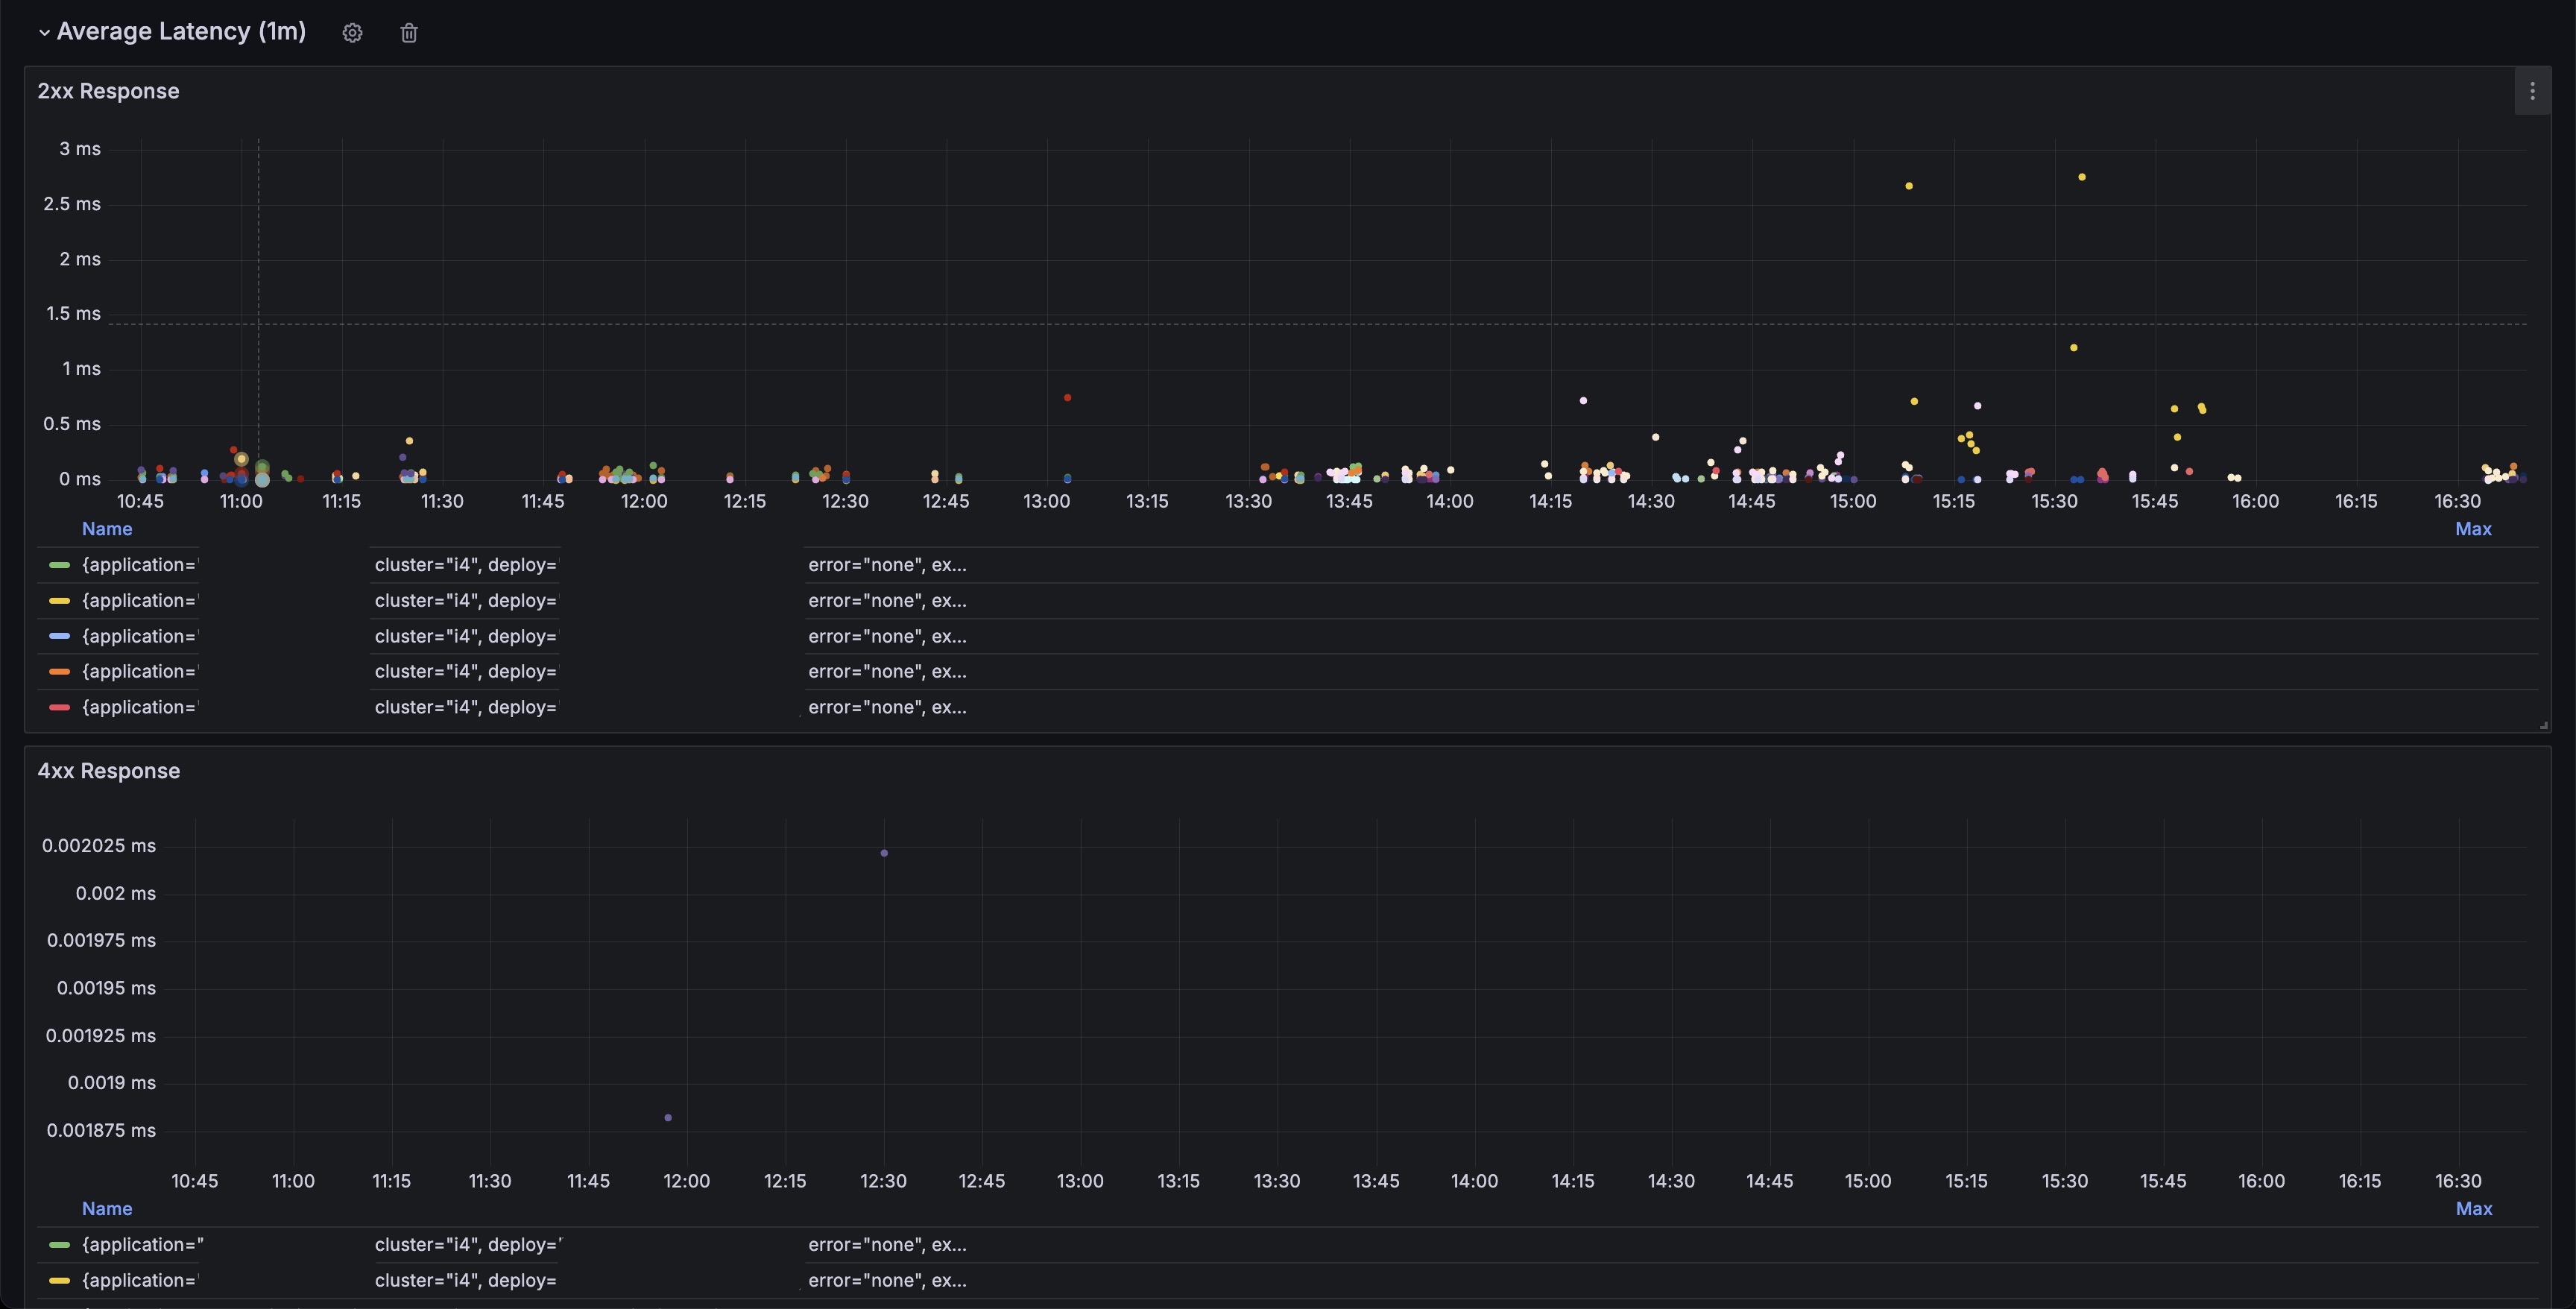
2xx Response
- Description: Displays the rate of successful HTTP responses (status code 2xx) over the last minute. This helps in understanding how often the application successfully handles requests.
- Metrics:
rate(http_server_requests_seconds_count[1m])
4xx Response
- Description: Shows the rate of client error HTTP responses (status code 4xx) over the last minute. This helps in identifying how often the clients are sending bad requests.
- Metrics:
rate(http_server_requests_seconds_count[1m])
5xx Response
- Description: Indicates the rate of server error HTTP responses (status code 5xx) over the last minute. This helps in identifying server-side issues that need to be addressed.
- Metrics:
rate(http_server_requests_seconds_count[1m])
2xx Response Time
- Description: Shows the average response time of successful HTTP requests (status code 2xx) over the last minute. This helps in understanding the performance of successful requests.
- Metrics:
irate(http_server_requests_seconds_sum[1m]) / irate(http_server_requests_seconds_count[1m])
4xx Response Time
- Description: Displays the average response time of client error HTTP requests (status code 4xx) over the last minute. This helps in identifying the response times for client errors.
- Metrics:
irate(http_server_requests_seconds_sum[1m]) / irate(http_server_requests_seconds_count[1m])
5xx Response Time
- Description: Indicates the average response time of server error HTTP requests (status code 5xx) over the last minute. This helps in identifying the response times for server errors.
- Metrics:
irate(http_server_requests_seconds_sum[1m]) / irate(http_server_requests_seconds_count[1m])
Data source config
Collector config:
Upload an updated version of an exported dashboard.json file from Grafana
| Revision | Description | Created | |
|---|---|---|---|
| Download |
Apache HTTP Server
Easily monitor Apache HTTP Server, an open source HTTP server for modern operating systems including UNIX and Windows, with Grafana Cloud's out-of-the-box monitoring solution.
Learn more