Spring Boot Cache (3.x)
This dashboard provides real-time monitoring of cache performance and status in a Spring Boot application. It uses Spring Boot Actuator to expose metrics, Prometheus for data collection, and Grafana for visualization.
Introduction
This dashboard is designed to monitor the state and performance of caches used in a Spring Boot application. It uses Spring Boot Actuator to expose metrics and Prometheus to collect and store these metrics. Grafana is then used to visualize the collected data, providing insights into the cache's behavior.
Panels Overview
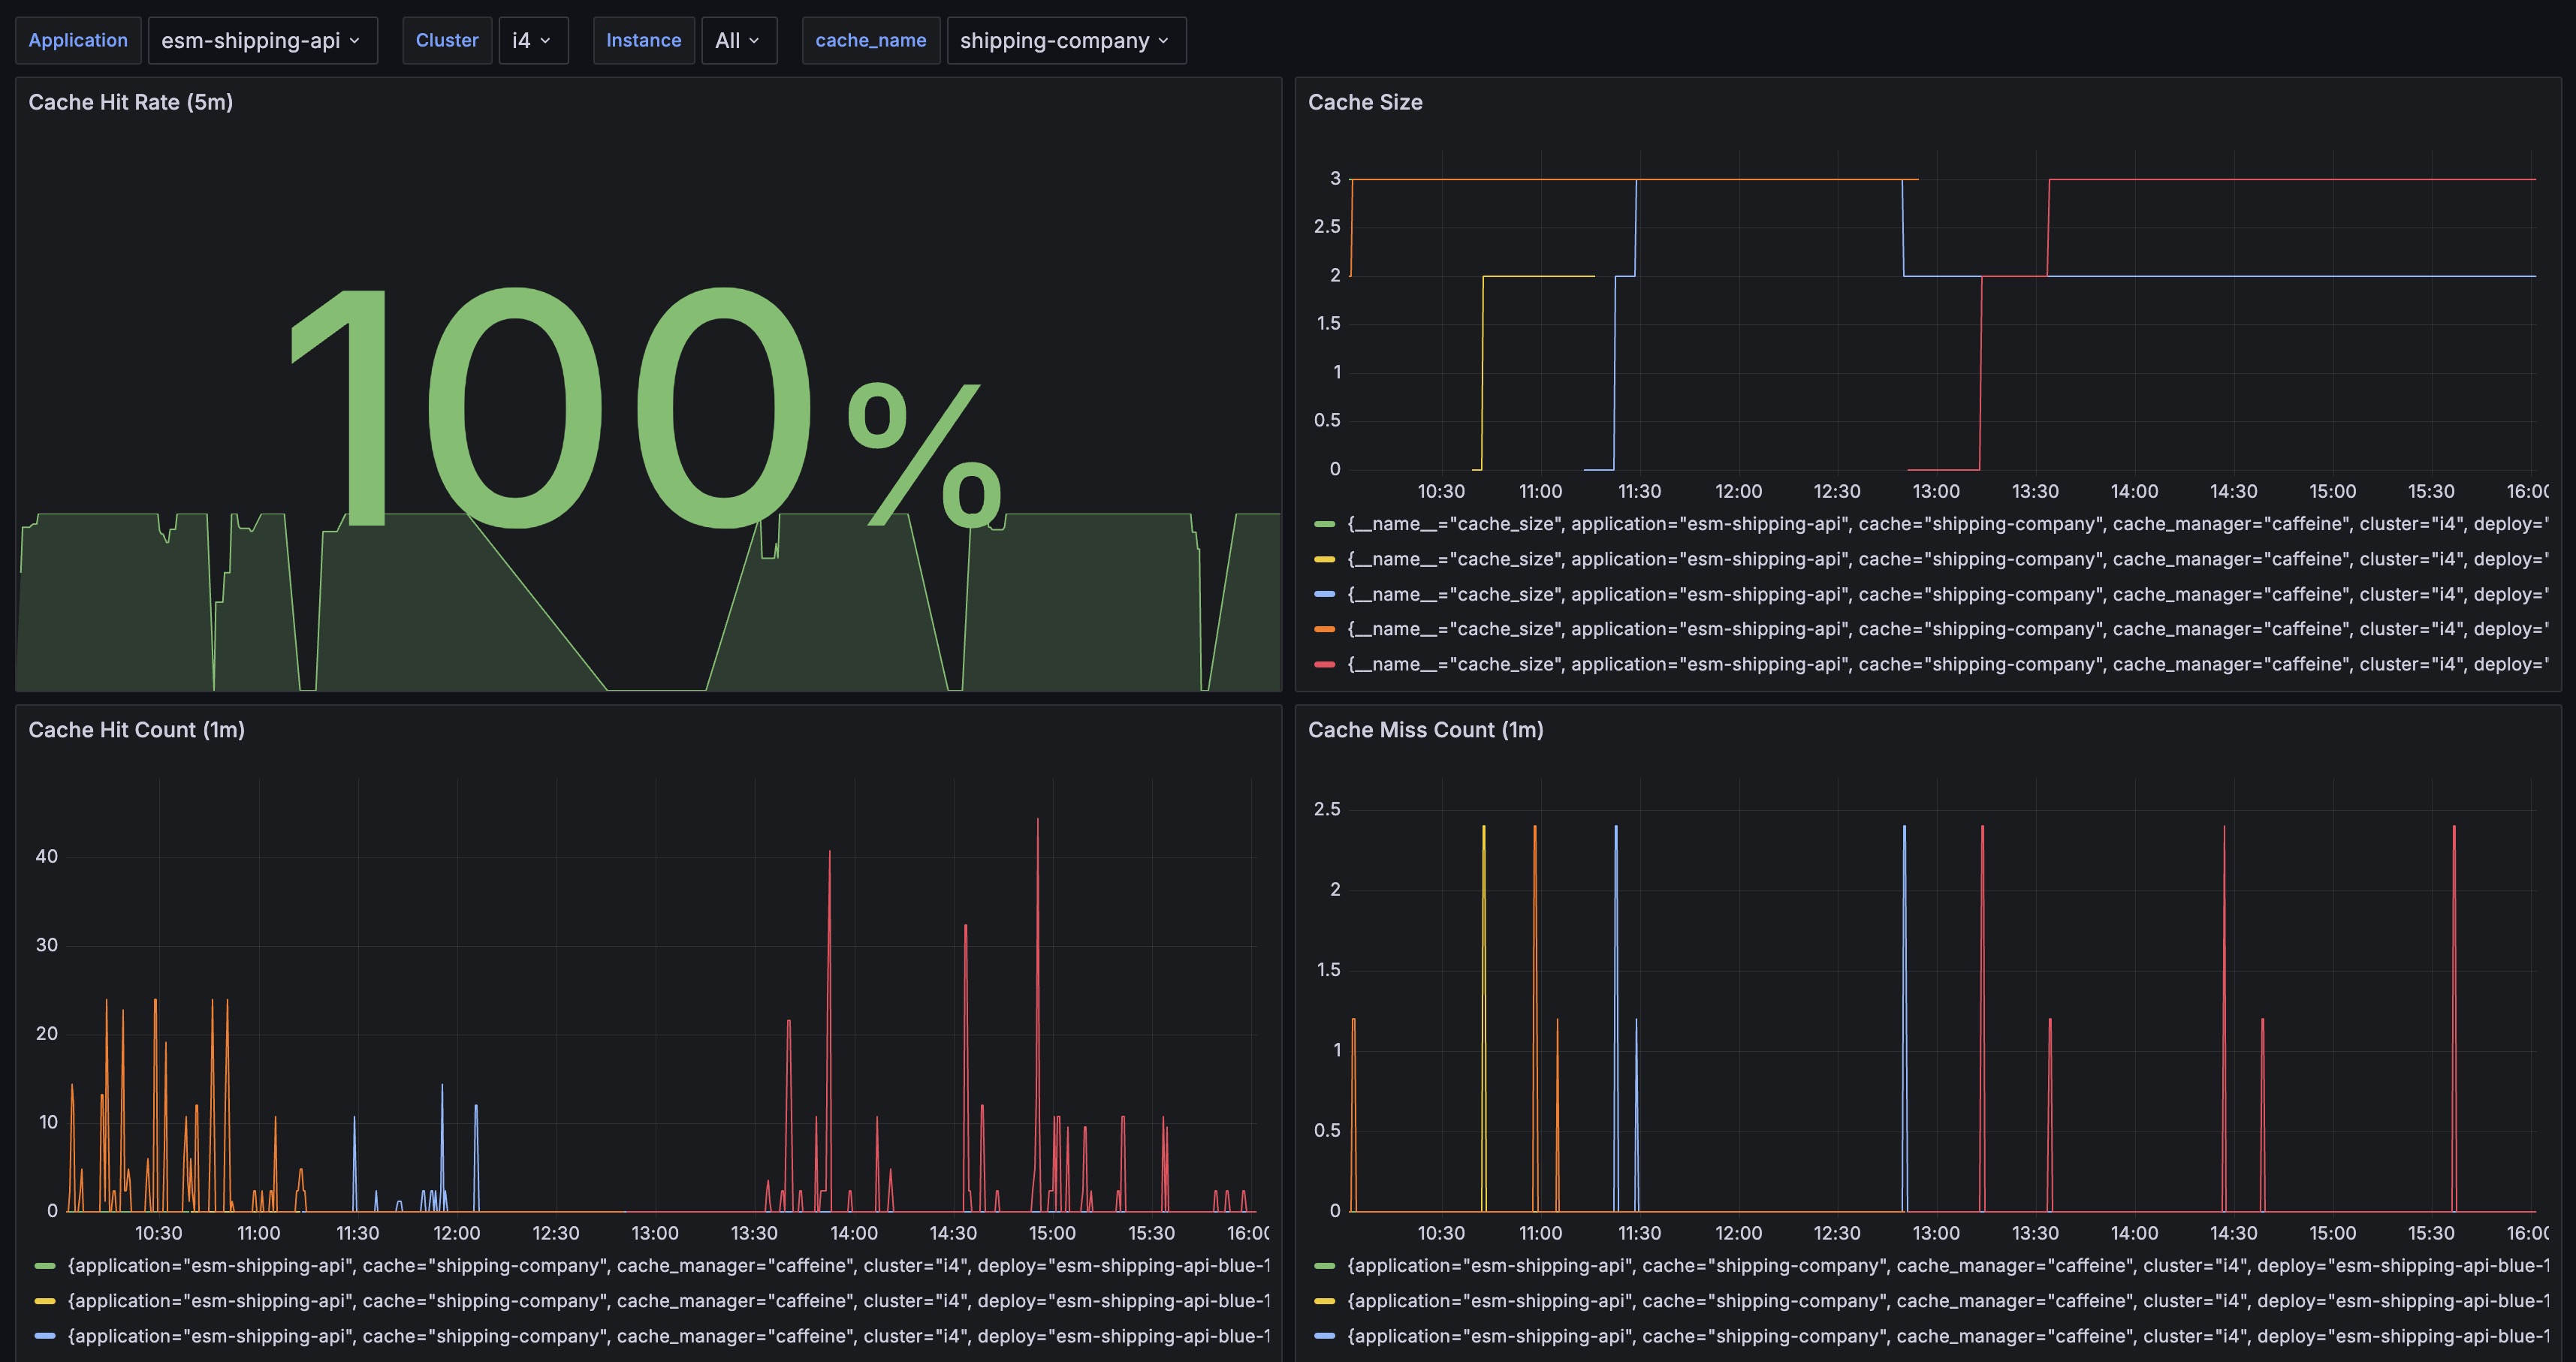
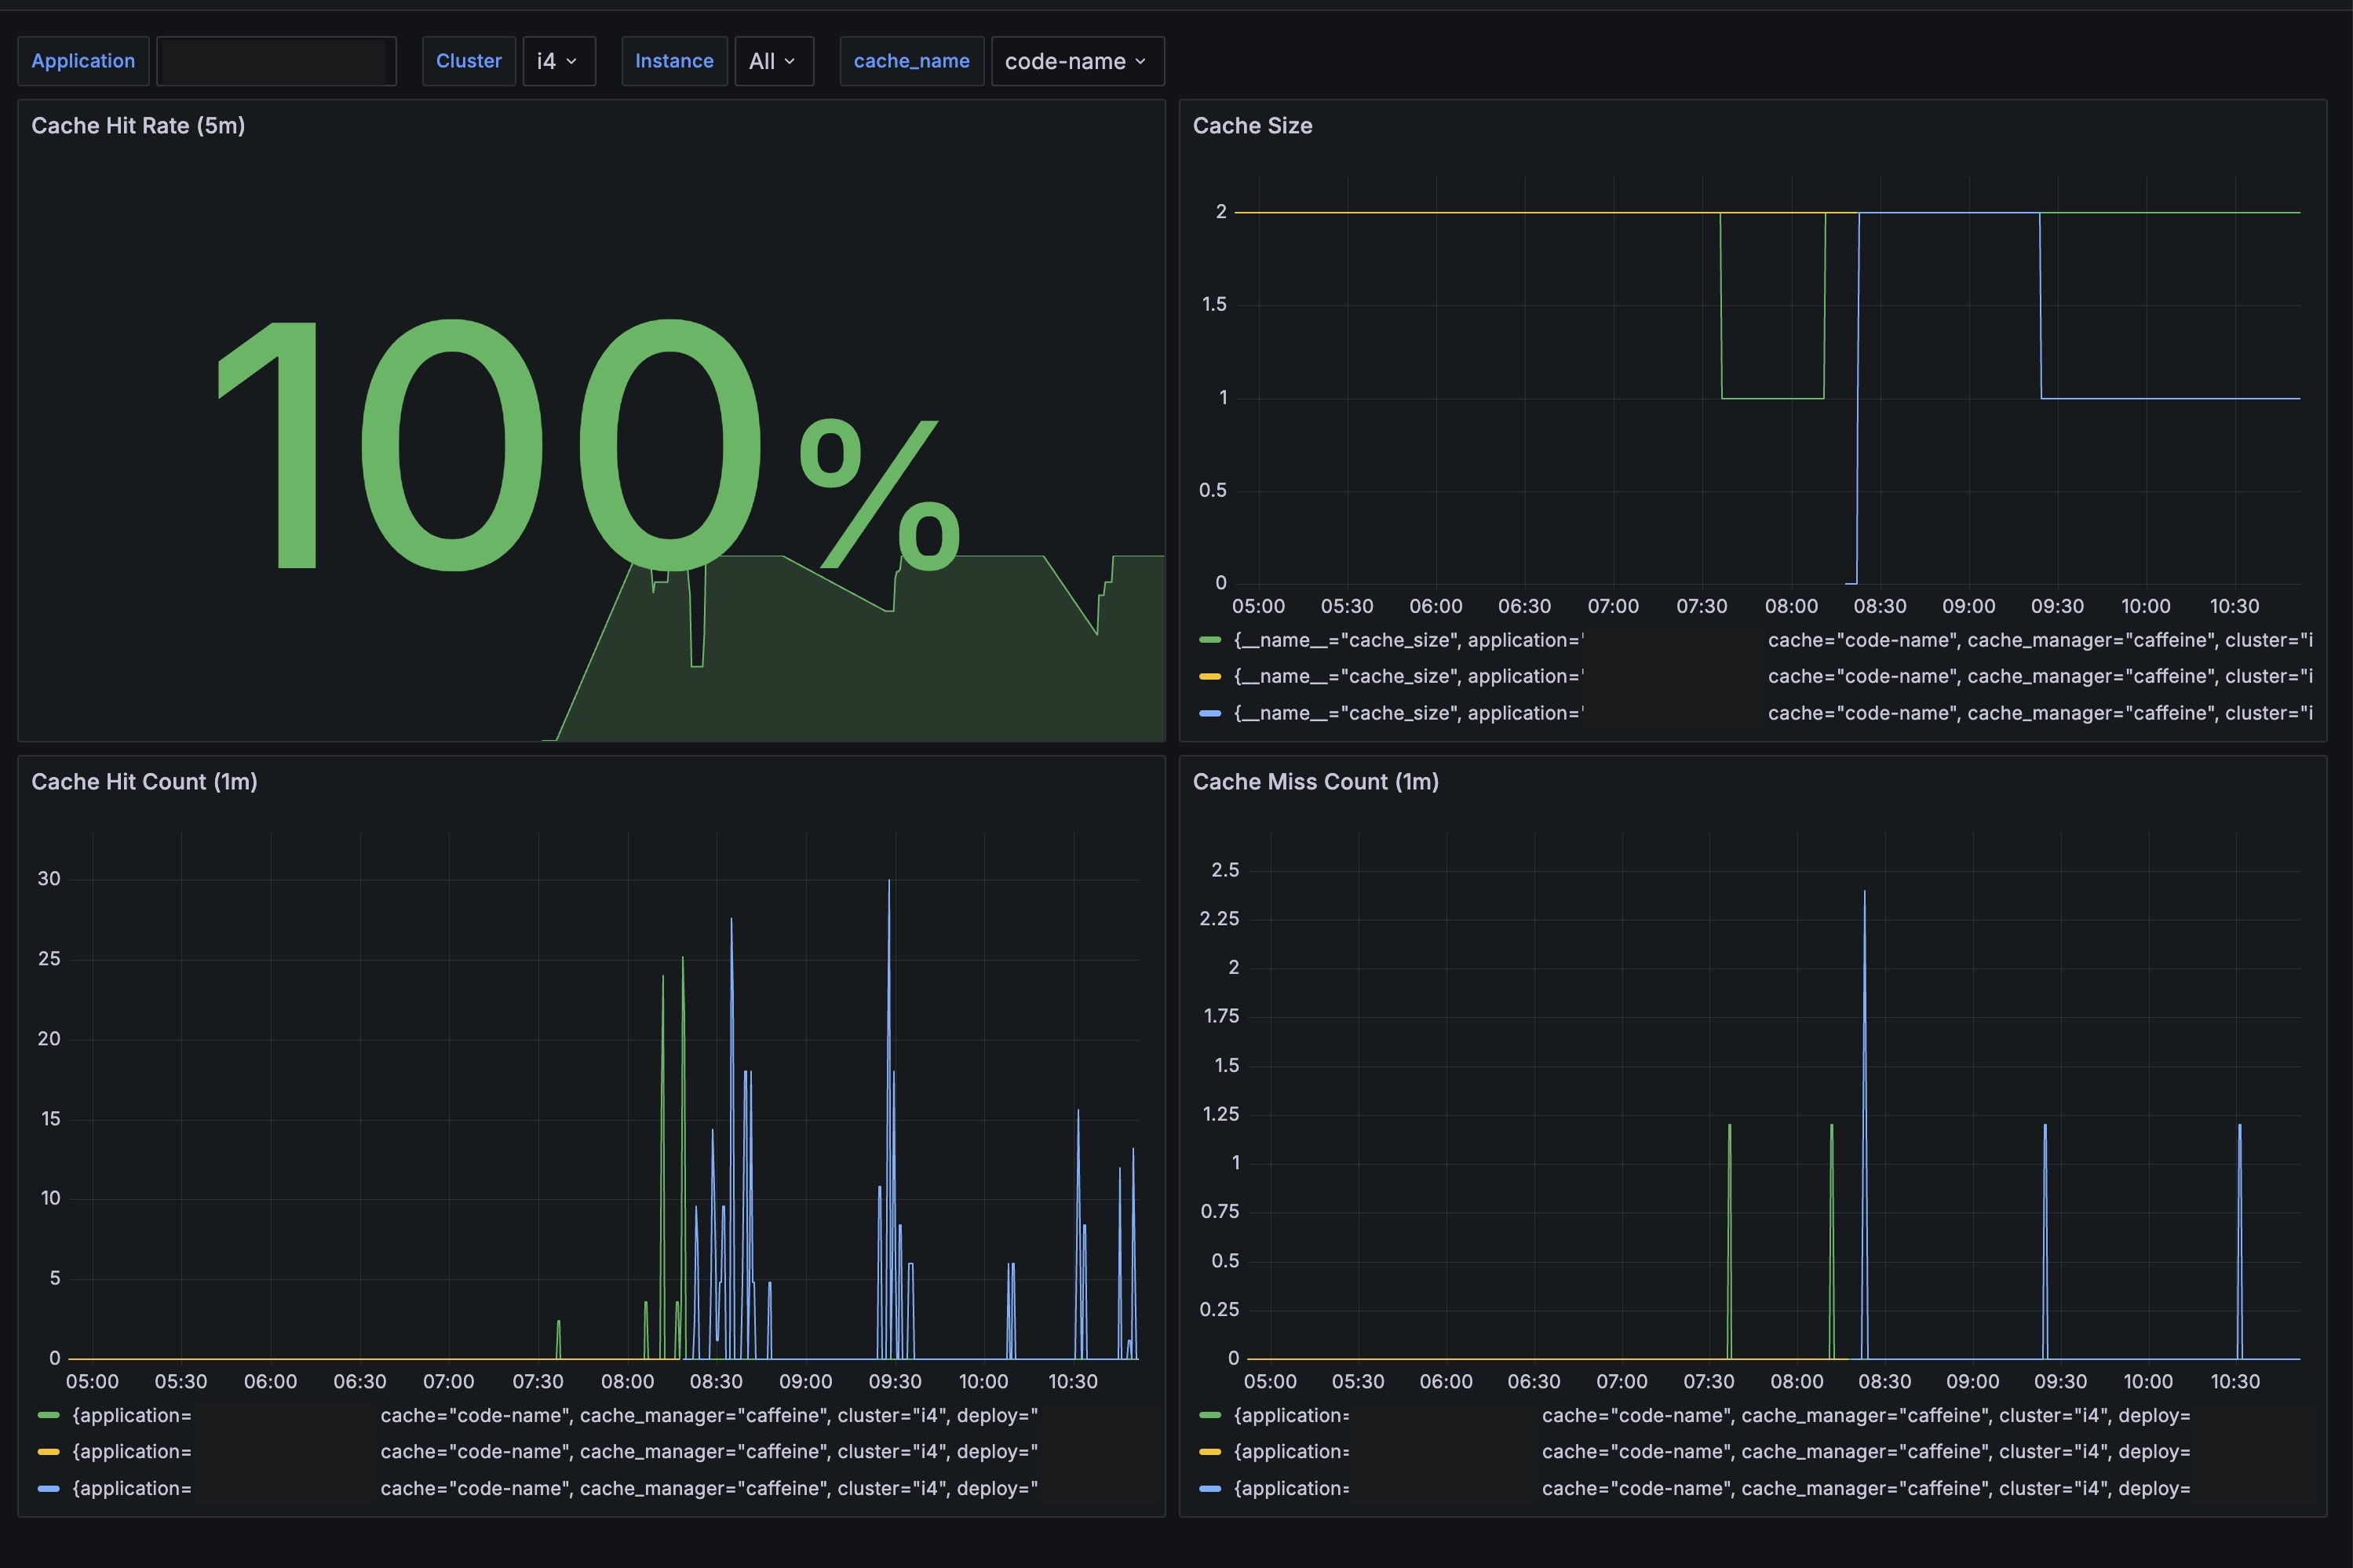
Cache Hit Rate (5m)
- Description: Displays the cache hit rate over the last 5 minutes as a percentage. This helps in understanding how efficiently the cache is performing.
- Metrics:
cache_gets_total
Cache Size
- Description: Shows the size of the cache over time. This helps in monitoring the capacity and utilization of the cache.
- Metrics:
cache_size
Cache Hit Count (1m)
- Description: Counts the number of cache hits in the last minute. This helps in understanding the usage and effectiveness of the cache.
- Metrics:
cache_gets_total{ result="hit"}
Cache Miss Count (1m)
- Description: Counts the number of cache misses in the last minute. This helps in identifying inefficiencies or issues with the cache.
- Metrics:
cache_gets_total{ result="miss"}
This dashboard is essential for maintaining the performance and efficiency of caches in microservices, allowing developers and operators to proactively identify and address issues.
Data source config
Collector config:
Upload an updated version of an exported dashboard.json file from Grafana
| Revision | Description | Created | |
|---|---|---|---|
| Download |
Spring Boot
Easily monitor Spring Boot with Grafana Cloud's out-of-the-box monitoring solution.
Learn more