Lagrange worker
This dashboard gives an overview over the worker's ZK Coprocessor performance.
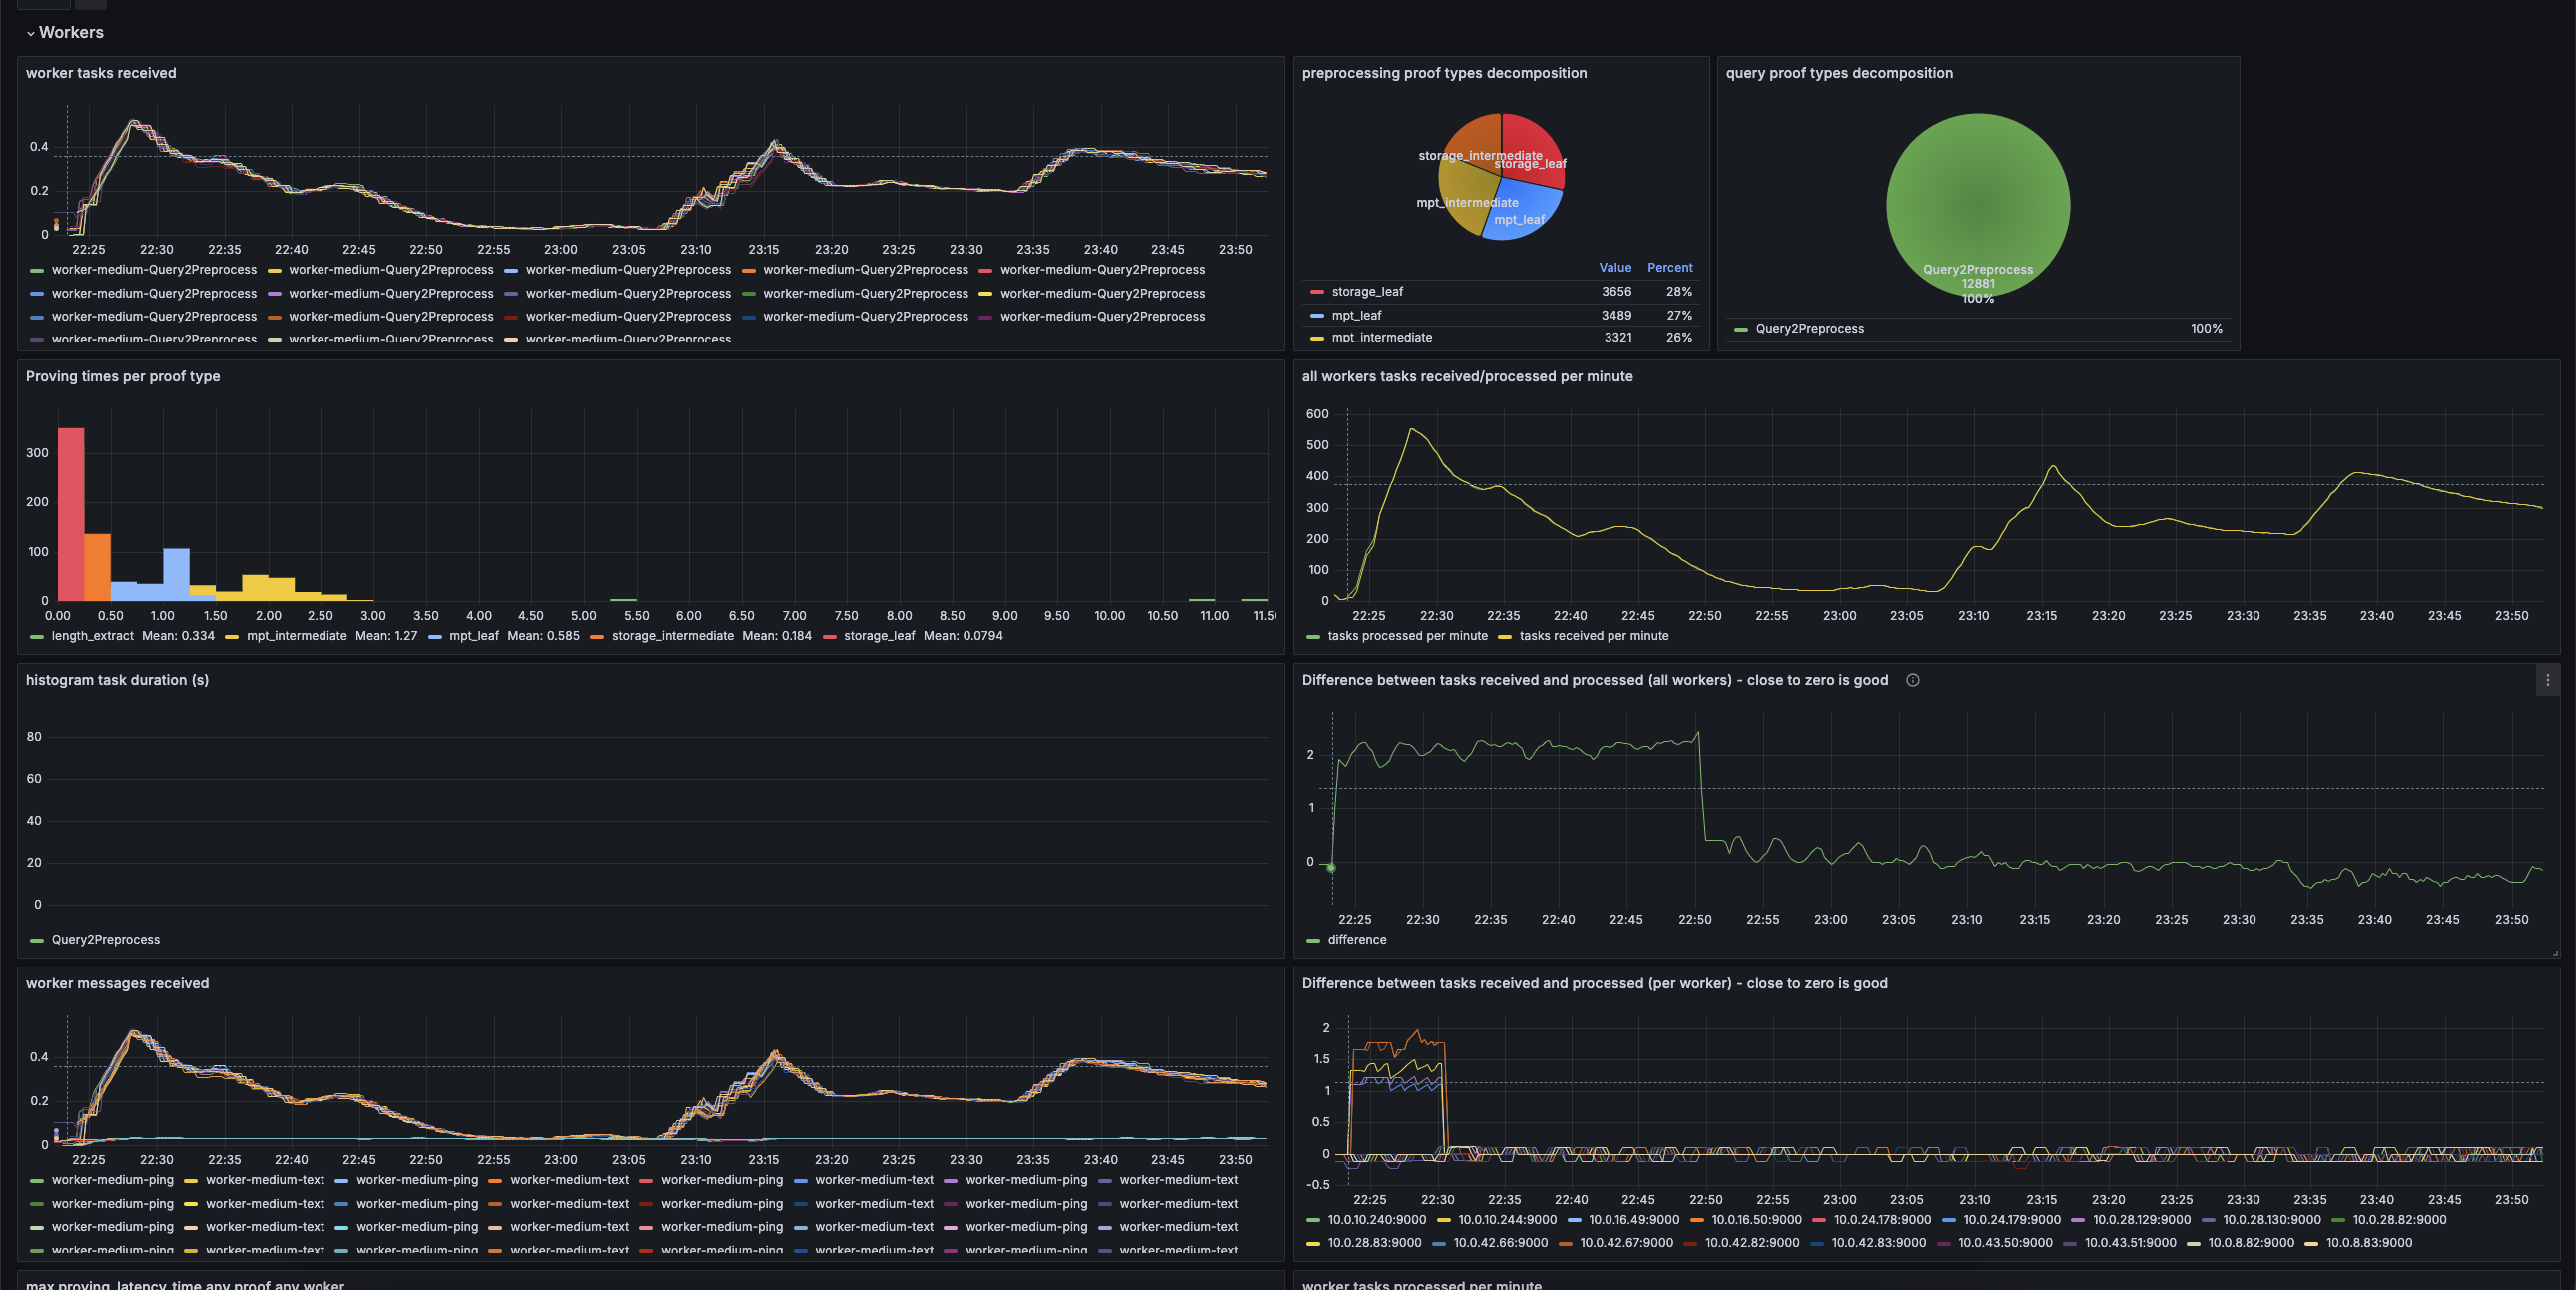
The Lagrange worker dashboard uses the prometheus data source to create a Grafana dashboard with the histogram, piechart and timeseries panels.
Data source config
Collector type:
Collector plugins:
Collector config:
Revisions
Upload an updated version of an exported dashboard.json file from Grafana
| Revision | Description | Created | |
|---|---|---|---|
| Download |