Kuberentes Dashboard
Dashboard for kubernetes
Kubernetes Dashboard
Features
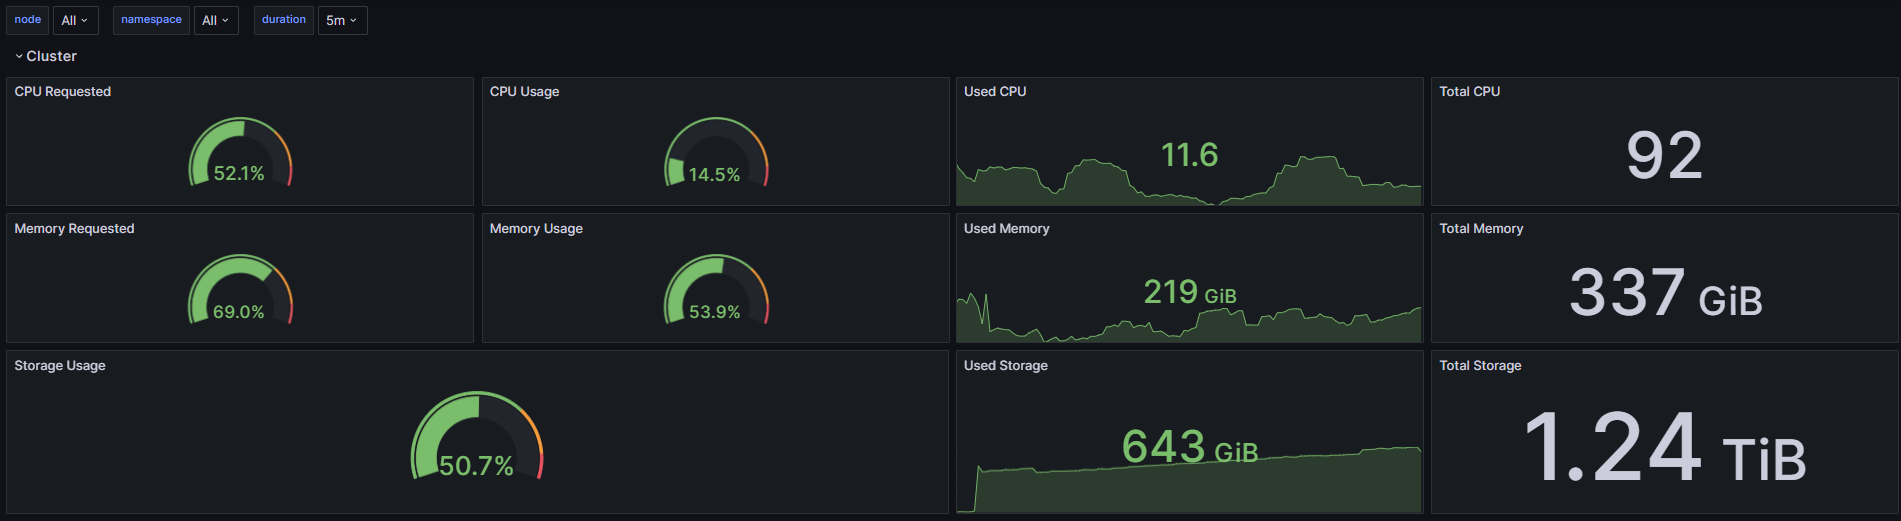
- Cluster
- Status: Displays the current status of your cluster.
- Usage: CPU, Memory, Storage and etc
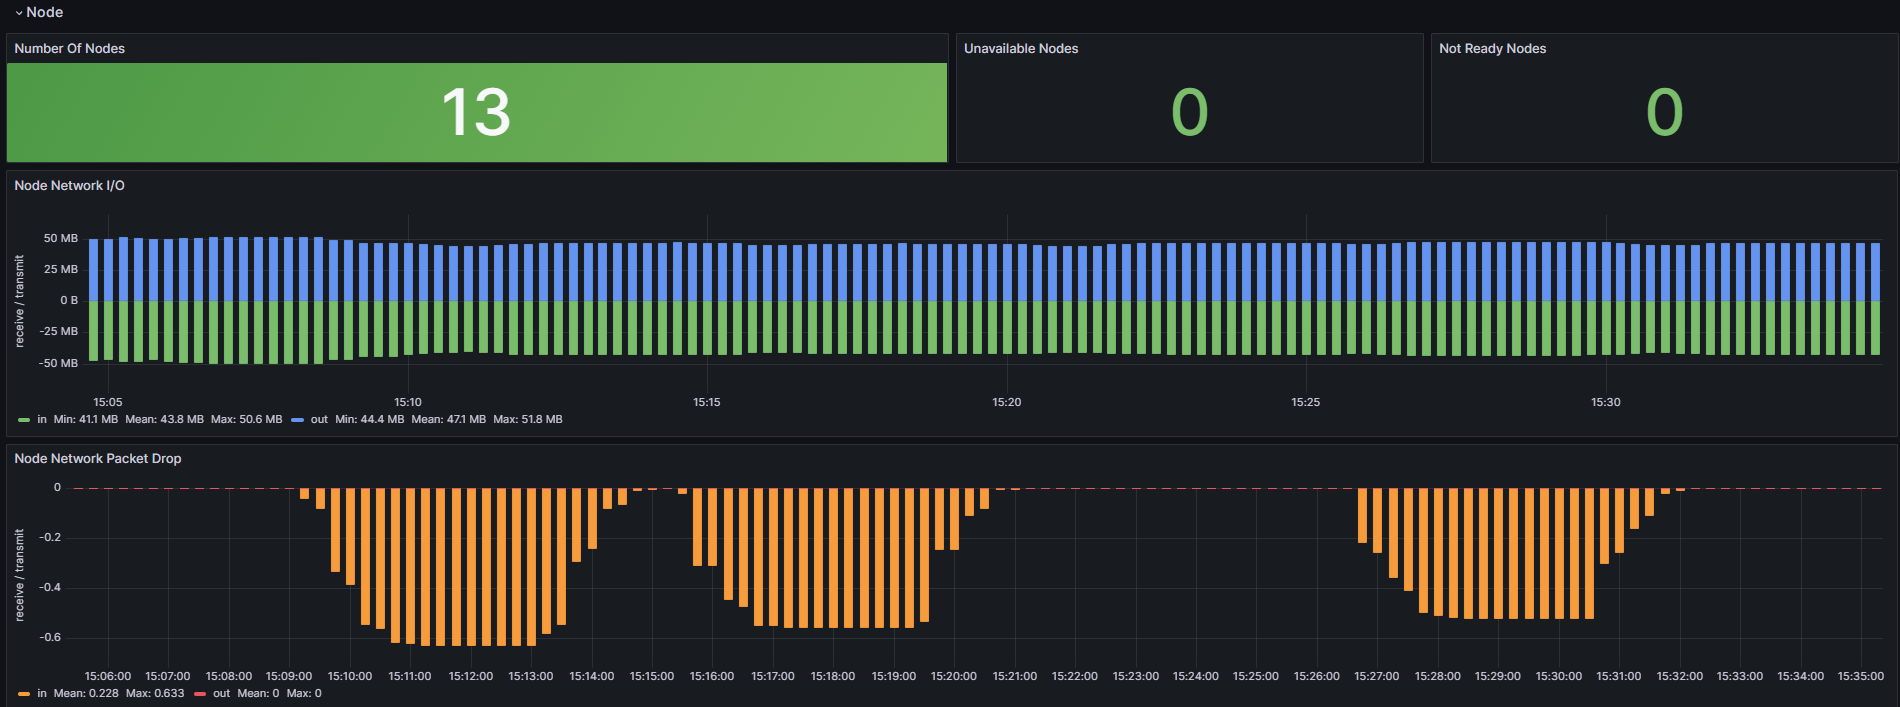
- Node
- Status: Display overall nodes status
- Network I/O: Monitor Network I/O of Nodes.
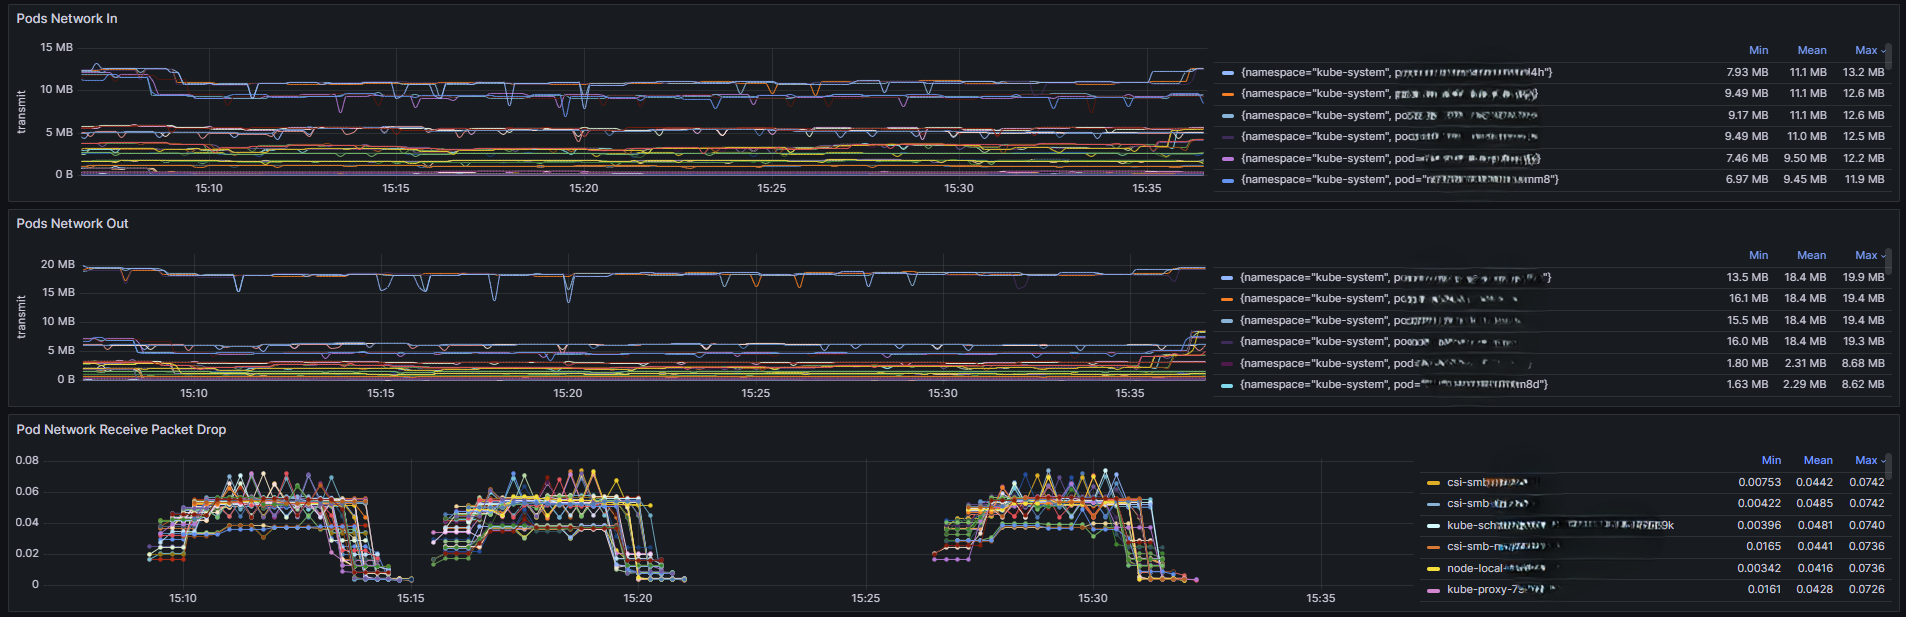
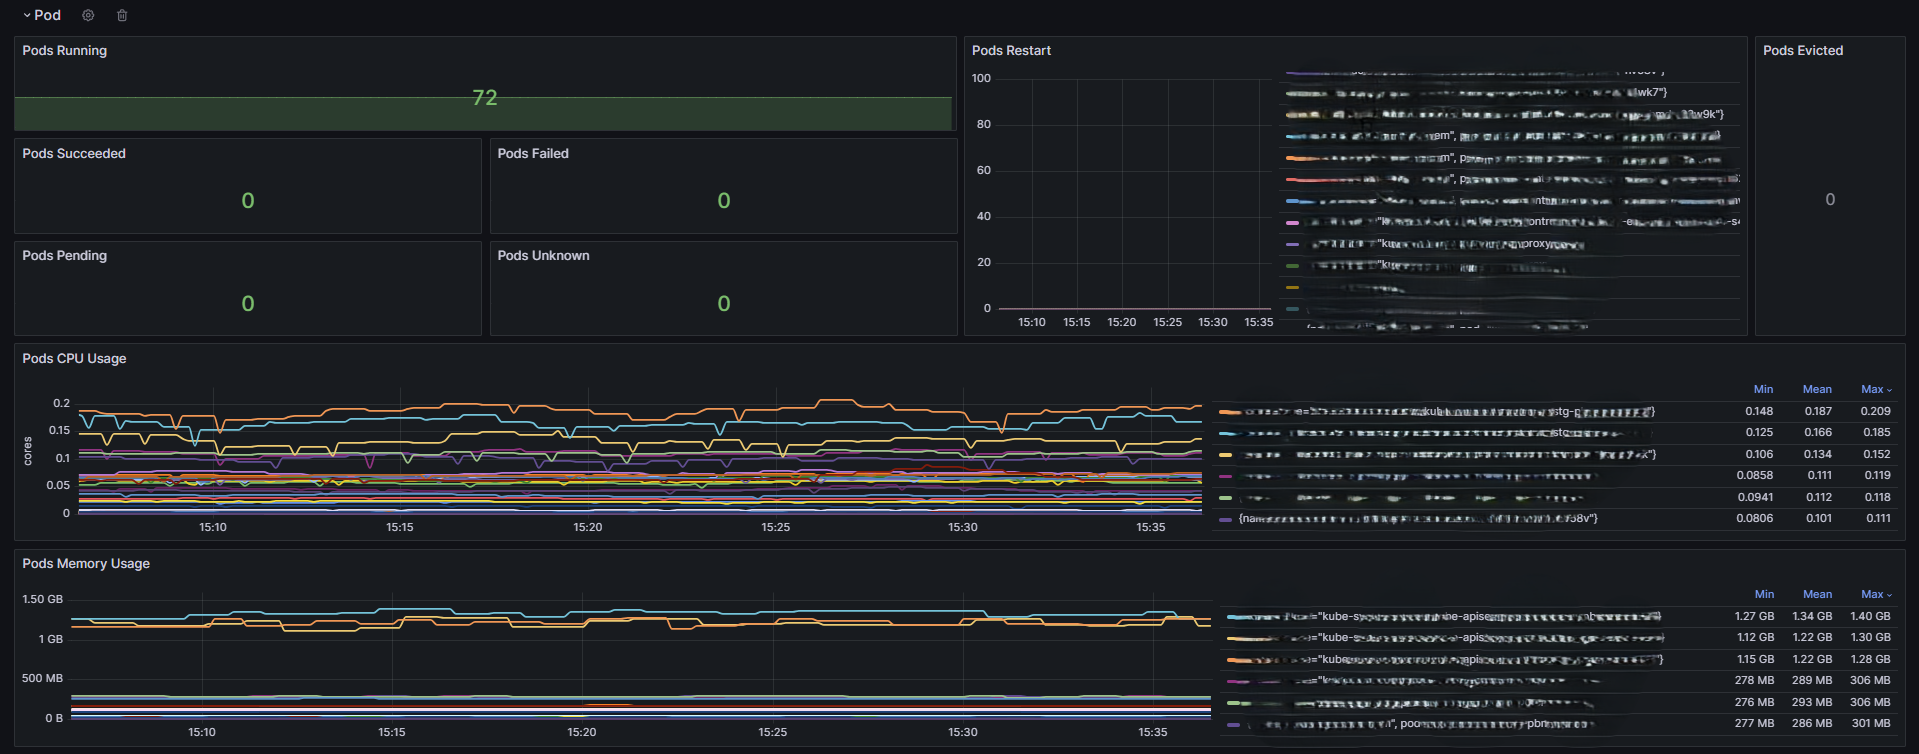
- Pod
- Status: Displays overall pod status
- Usage: CPU, Memory, Network
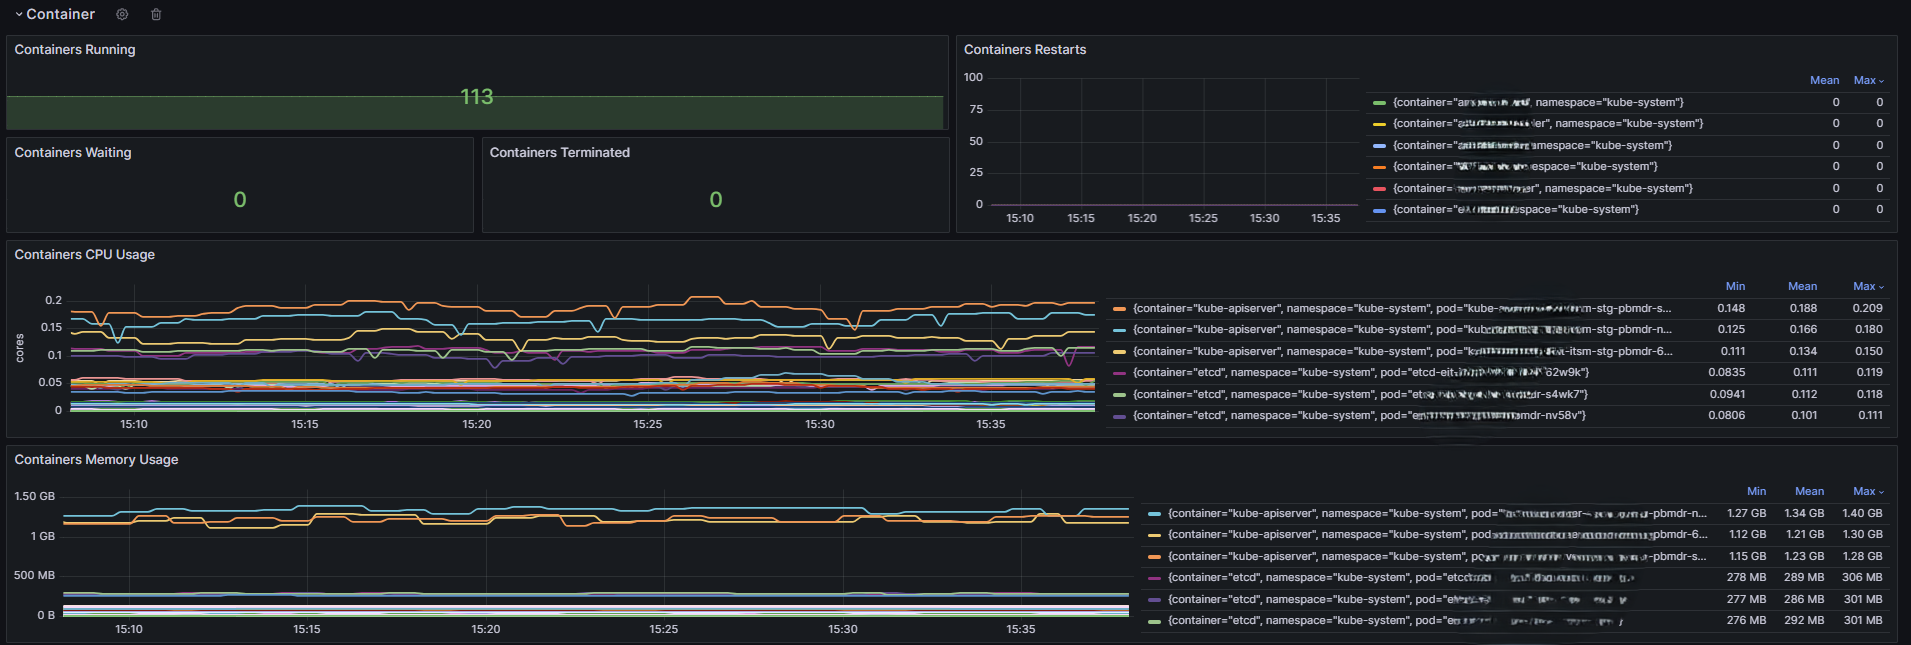
- Container
- Status: Displays overall container status
- Usage: CPU, Memory
Getting Started
Prerequisites
Data Sources: Make sure your data sources (Prometheus) are configured in Grafana.
Installation
Import Dashboard:
- Navigate to the Grafana home page.
- Click on the + icon on the left side bar and select Import.
- Upload the provided dashboard JSON file or paste the JSON content directly.
Configure Data Sources:
- Go to Configuration > Data Sources.
- Add and configure the necessary data sources used in the dashboard.
Usage
Access Dashboard:
- Go to Home > Dashboards.
- Select the imported dashboard from the list.
Select Time Range:
- Use the time range selector at the top right corner of the dashboard to choose the desired time frame.
Filter by node:
- Use the node dropdown to filter the displayed metrics by specific namespaces.
Filter by Namespace:
- Use the namespace dropdown to filter the displayed metrics by specific namespaces.
Interacting with Panels:
- Hover over graph panels to view detailed metrics.
- Click on legends to toggle the visibility of specific data series.
- Use the panel options to customize the display (zoom, drill down, etc.).
Data source config
Collector type:
Collector plugins:
Collector config:
Revisions
Upload an updated version of an exported dashboard.json file from Grafana
| Revision | Description | Created | |
|---|---|---|---|
| Download |