Kubernetes Pod Dashboard
Dashboard for kubernetes pod
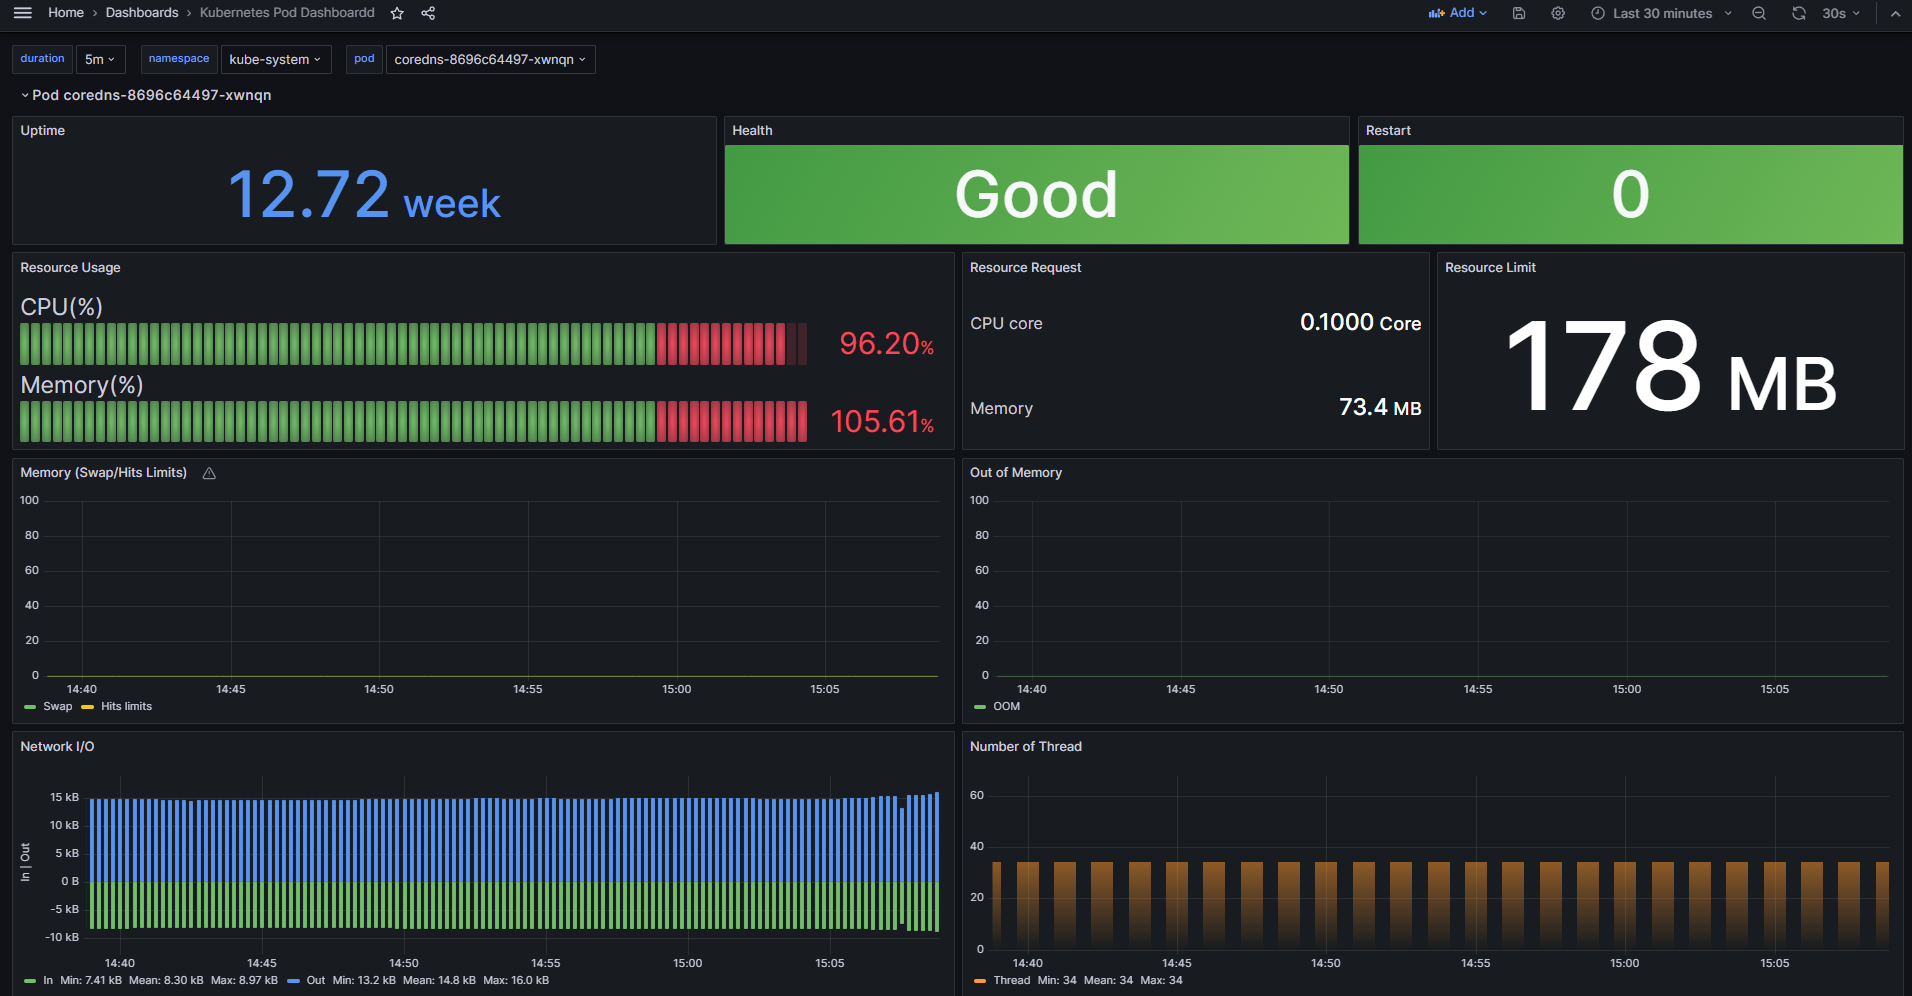
Kubernetes Pod Dashboard
Features
Uptime Monitoring Uptime: Displays the uptime of your pod.
Resource Usage CPU Usage: Monitor pod CPU usage. Memory Usage: Track pod memory consumption.
Network I/O Inbound Traffic: View the amount of data received over the network. Outbound Traffic: Track the data sent out over the network.
Search by Duration and Namespace Time Range Selector: Easily select predefined time ranges or set custom start and end times to view data. Namespace Filter: Filter metrics by specific namespaces to focus on relevant data.
Getting Started
Prerequisites
Data Sources: Make sure your data sources (Prometheus) are configured in Grafana.
Installation
Import Dashboard:
- Navigate to the Grafana home page.
- Click on the + icon on the left side bar and select Import.
- Upload the provided dashboard JSON file or paste the JSON content directly.
Configure Data Sources:
- Go to Configuration > Data Sources.
- Add and configure the necessary data sources used in the dashboard.
Usage
Access Dashboard:
- Go to Home > Dashboards.
- Select the imported dashboard from the list.
Select Time Range:
- Use the time range selector at the top right corner of the dashboard to choose the desired time frame.
Filter by Namespace:
- Use the namespace dropdown to filter the displayed metrics by specific namespaces.
Interacting with Panels:
- Hover over graph panels to view detailed metrics.
- Click on legends to toggle the visibility of specific data series.
- Use the panel options to customize the display (zoom, drill down, etc.).
Data source config
Collector config:
Upload an updated version of an exported dashboard.json file from Grafana
| Revision | Description | Created | |
|---|---|---|---|
| Download |
Kubernetes
Monitor your Kubernetes deployment with prebuilt visualizations that allow you to drill down from a high-level cluster overview to pod-specific details in minutes.
Learn more