Kubernetes Statefulset CPU and Memory Metrics
Simple dashboard for observing your Kubernetes Statefulset CPU and Memory usage.
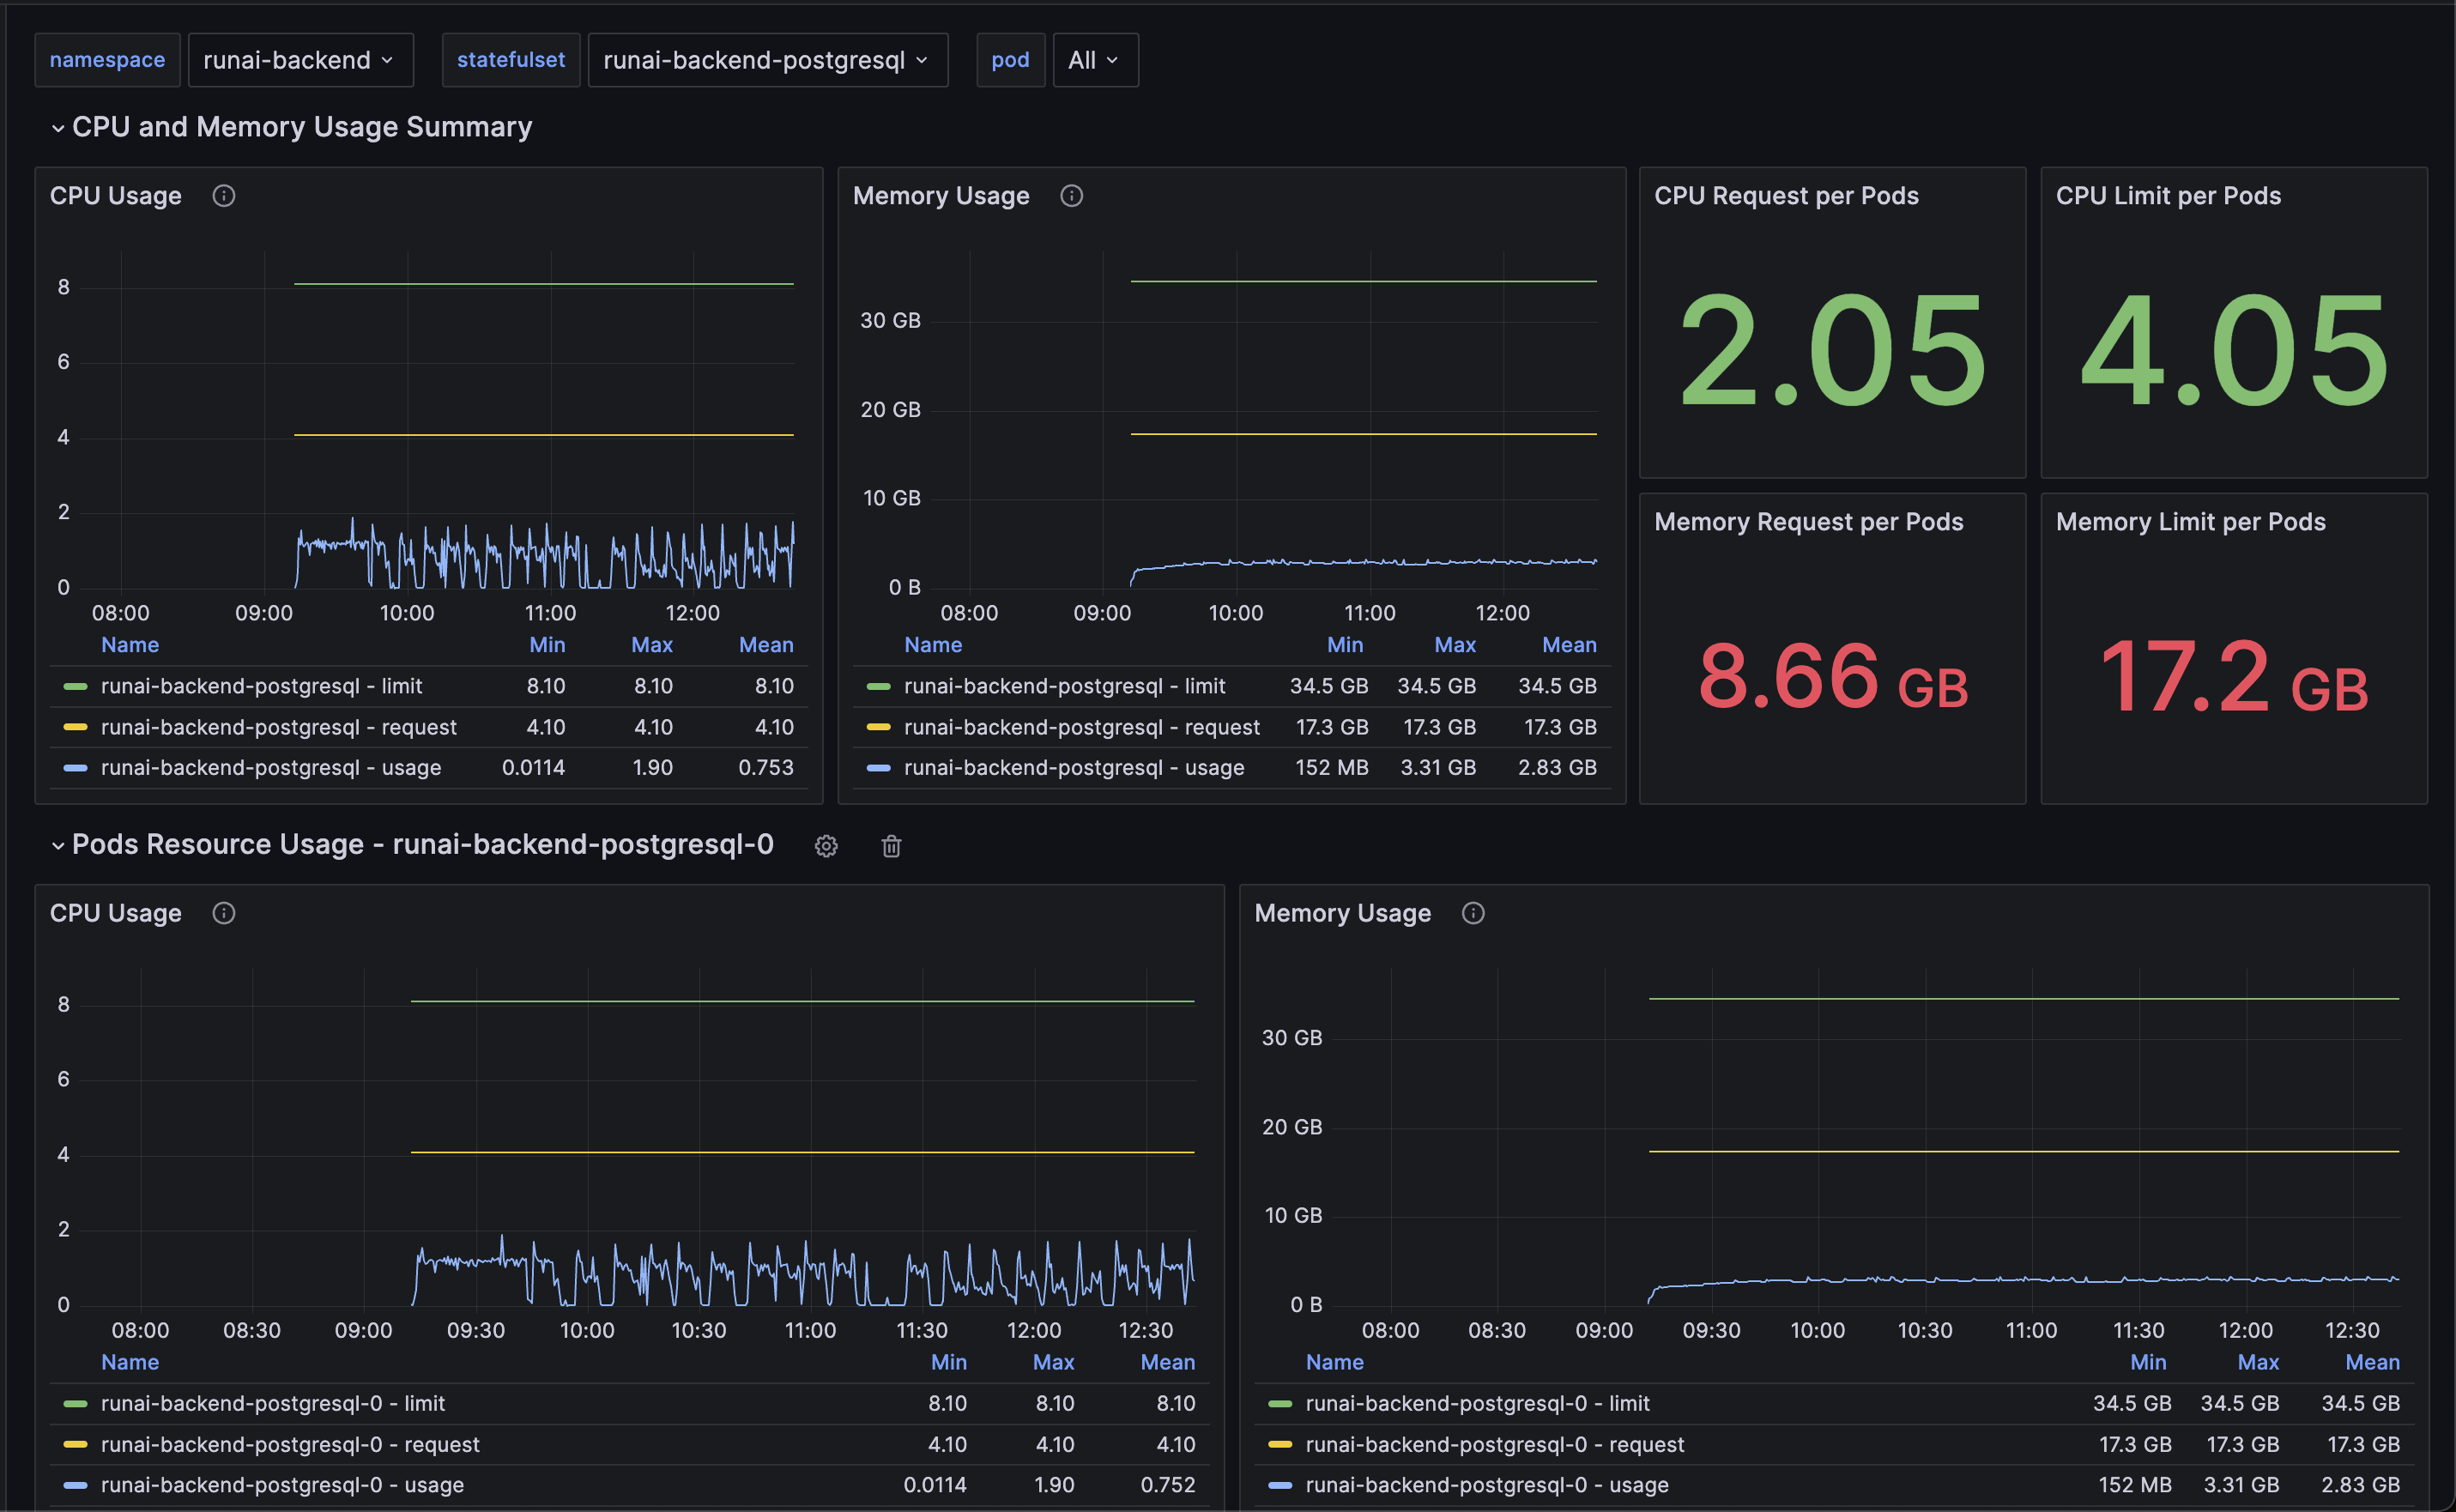
The Kubernetes Statefulset CPU and Memory Metrics dashboard uses the prometheus data source to create a Grafana dashboard with the stat and timeseries panels.
Data source config
Collector type:
Collector plugins:
Collector config:
Revisions
Upload an updated version of an exported dashboard.json file from Grafana
| Revision | Description | Created | |
|---|---|---|---|
| Download |
Kubernetes
Monitor your Kubernetes deployment with prebuilt visualizations that allow you to drill down from a high-level cluster overview to pod-specific details in minutes.
Learn more