Windows Servers Network Overview
This dashboard shows the network bandwidth used by the Windows servers in a Prometheus data source. Any number of servers can be selected, and all the graphs display on one page.
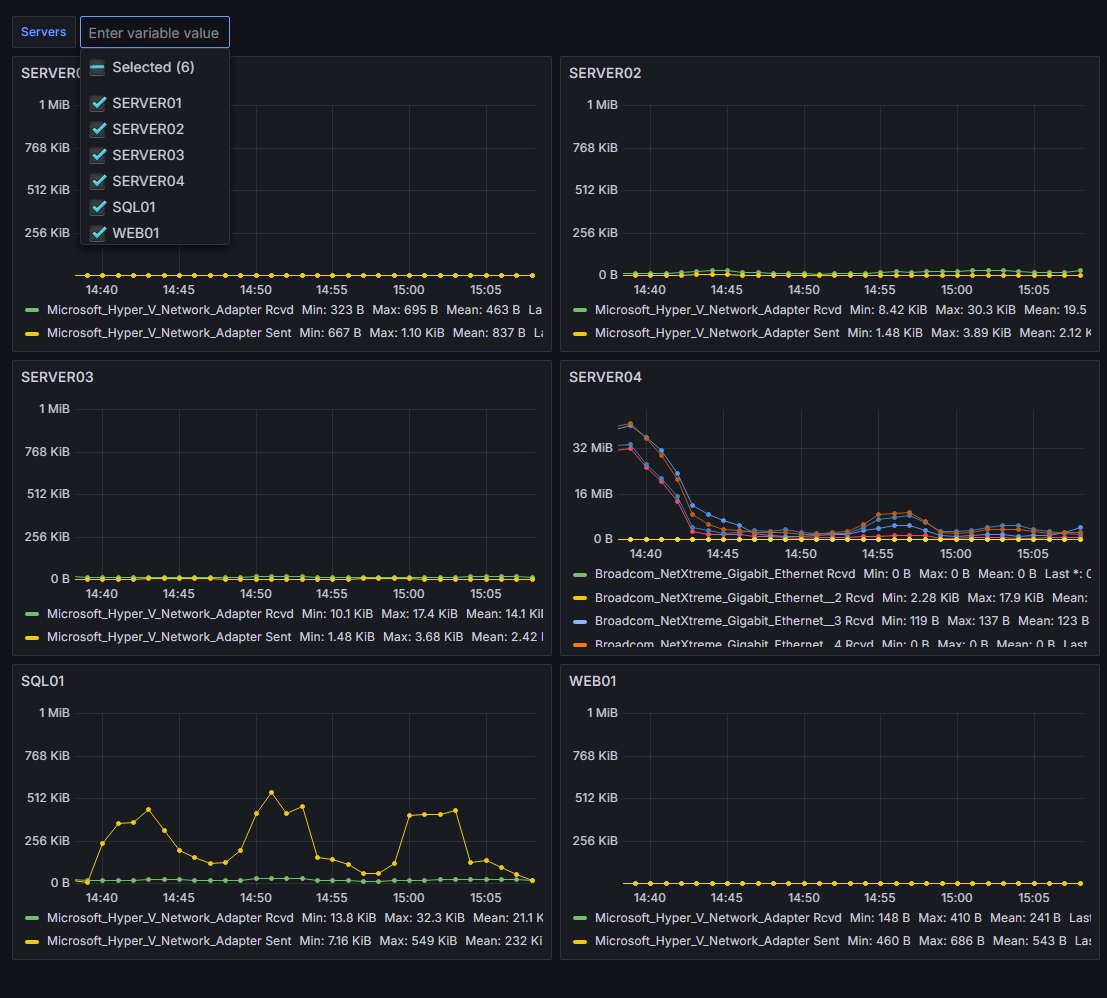
This dashboard shows the network bandwidth used by the Windows servers in a Prometheus data source. Metrics are collected using windows_exporter. Any number of servers can be selected, and all the graphs display on one page.
- The servers can be selected using the drop down at the top of the page
- A soft max of 1 MiB is used to keep small fluctuations on the Y axis from appearing more significant than they are. Without a soft max, the Y axis automatically adjusts to the data, so no matter how little the data flucutates it will always take up the whole graph.
- It uses rate instead of irate
- It doesn't seem like this should be necessary to mention, but every other community dashboard I looked at uses irate
- References:
More detailed info: GitHub repo
For those interested in making similar dashboards, the key to making this dashboard work was to define a variable of all the windows servers, create a single panel displaying the desired information for a single server, and then using the Panel options > Repeat options to repeat it for each Windows server selected.
Data source config
Collector config:
Upload an updated version of an exported dashboard.json file from Grafana
| Revision | Description | Created | |
|---|---|---|---|
| Download |
Windows
Easily monitor your deployment of the Windows operating system with Grafana Cloud's out-of-the-box monitoring solution.
Learn more