Windows Servers Overview
This dashboard provides a summary of all the Windows servers in a Prometheus data source, with metrics collected via windows_exporter
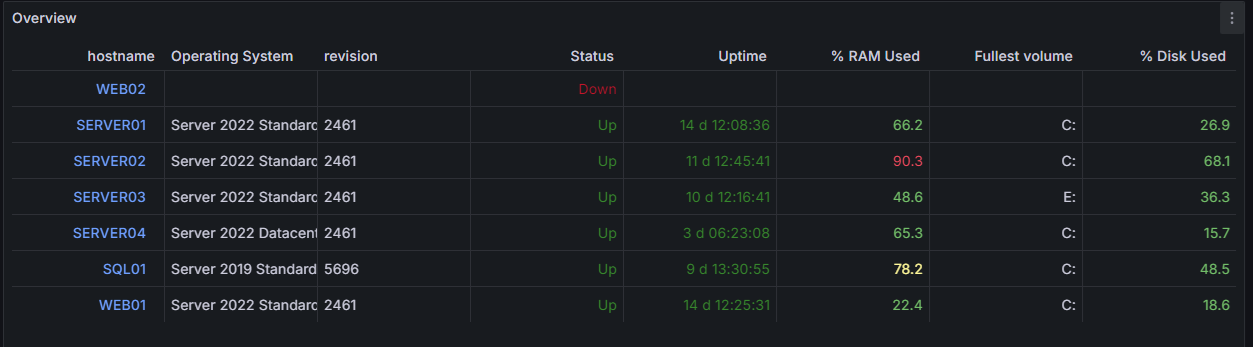
This dashboard provides a summary of all the Windows servers in a Prometheus data source. It uses windows_exporter to collect metrics.
- It sorts by
Statusfollowed byHostname, so servers that are down are at the top. This can be overridden by sorting by any column. Revisionshows the latest OS update, which is useful as a quick check that the operating system is fully patched- Thresholds are set to draw attention to potential problems (servers that have rebooted recently, servers that are low on RAM, or servers that have nearly full volumes)
- It shows the volume with the least disk space available (by percentage of total space) and how much space is being used
- It uses rate instead of irate
- It doesn't seem like this should be necessary to mention, but every other community dashboard I looked at uses irate
- References:
- The
Hostnamecan be configured as a link to a dashboard showing more detailed metrics for that server (see notes below)
More detailed info: GitHub repo
Linking Server Specific Metrics using the Hostname field
- Add a field override using the "Fields with name" option, and specify the
Hostnamefield - Add an override property using the "Data Links" option
- Add a link
- Title: $hostname
- URL: <dashboard specific URL>&var-hostname=${__data.fields.hostname}
- Example: /grafana/d/edgz29vfxxdkwe/windows-server?orgId=1&var-hostname=${__data.fields.hostname}
Note: You could specify the dashboard UID in your JSON file to avoid having to manually configure this. However, if a dashboard already exists with that UID, it will be overwritten.
Data source config
Collector type:
Collector plugins:
Collector config:
Revisions
Upload an updated version of an exported dashboard.json file from Grafana
| Revision | Description | Created | |
|---|---|---|---|
| Download |
Windows
Easily monitor your deployment of the Windows operating system with Grafana Cloud's out-of-the-box monitoring solution.
Learn more