Windows Server
Provides metrics about a single Windows Server from a Prometheus datasource collected with windows_exporter
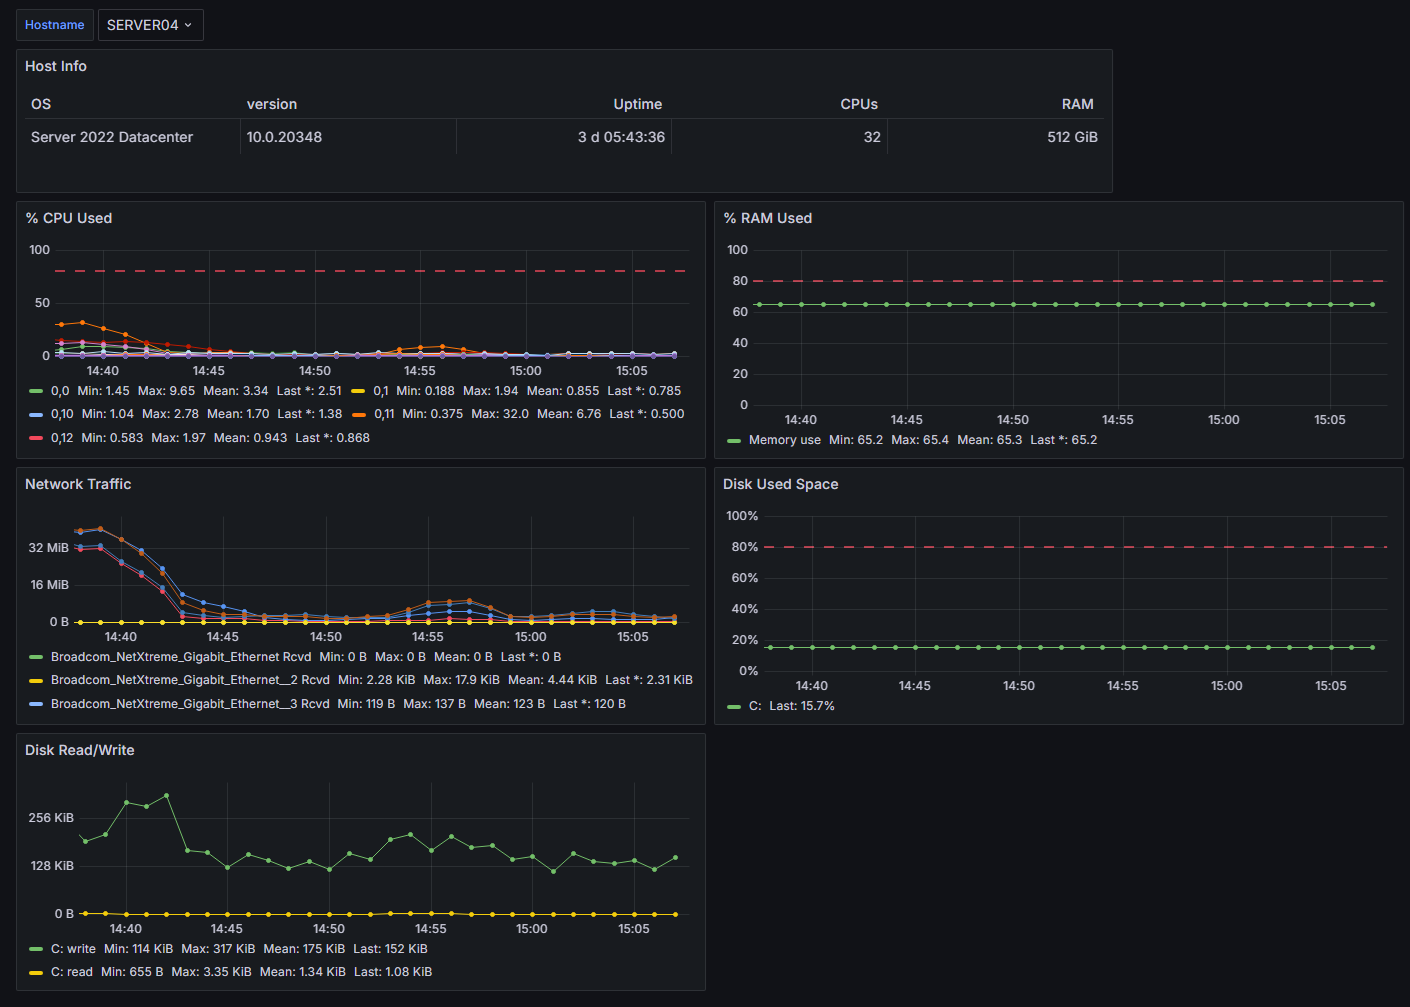
This dashboard provides metrics about a single Windows Server. It relies on data collected by Prometheus using windows_exporter.
- The server can be selected from the drop down at the top
- It uses rate instead of irate
- It doesn't seem like this should be necessary to mention, but every other community dashboard I looked at uses irate
- References:
More detailed info: GitHub repo
Data source config
Collector type:
Collector plugins:
Collector config:
Revisions
Upload an updated version of an exported dashboard.json file from Grafana
| Revision | Description | Created | |
|---|---|---|---|
| Download |
Windows
Easily monitor your deployment of the Windows operating system with Grafana Cloud's out-of-the-box monitoring solution.
Learn more