EKS Control Plane
This dashboard graphs EKS Control Plane metrics as described in the EKS best practices guide: https://aws.github.io/aws-eks-best-practices/reliability/docs/controlplane/#monitor-control-plane-metrics. It tracks API server activity, admission controller performance, client request latencies, and the etcd database size.
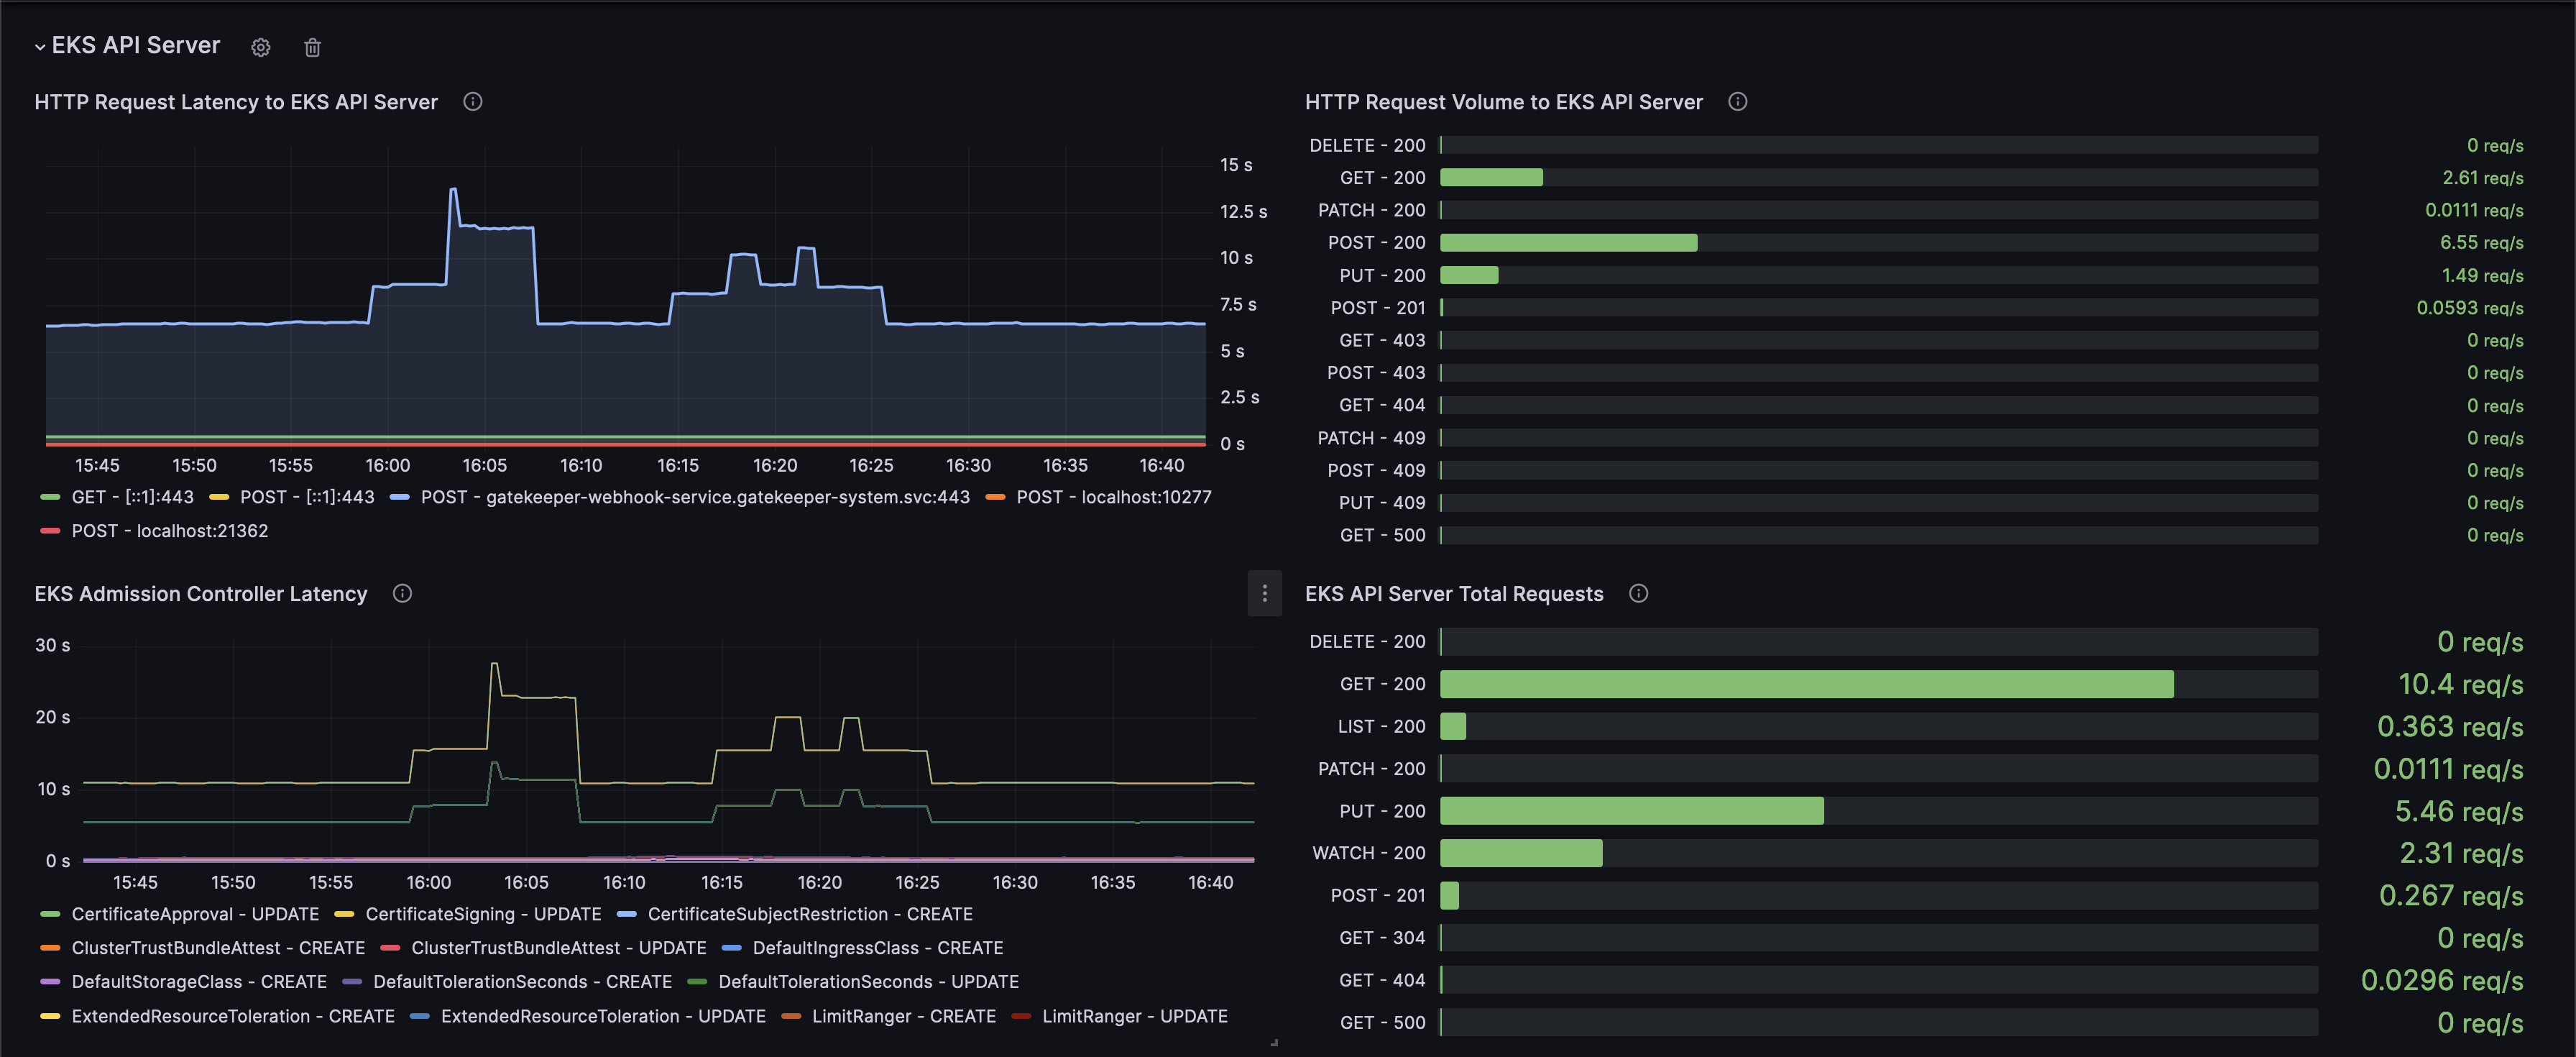
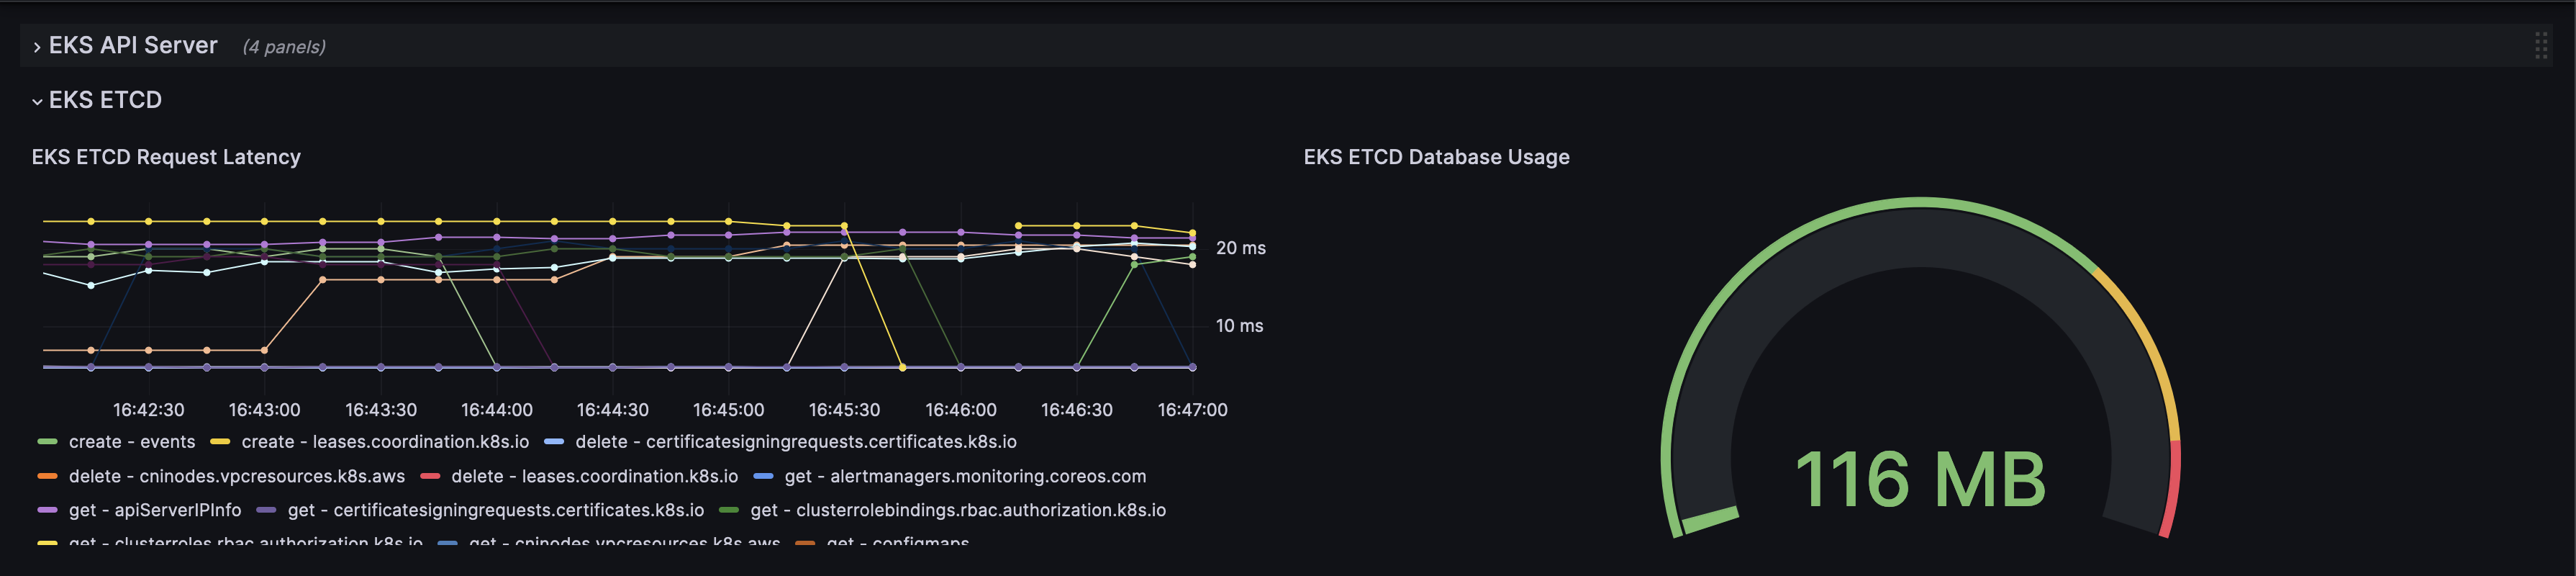
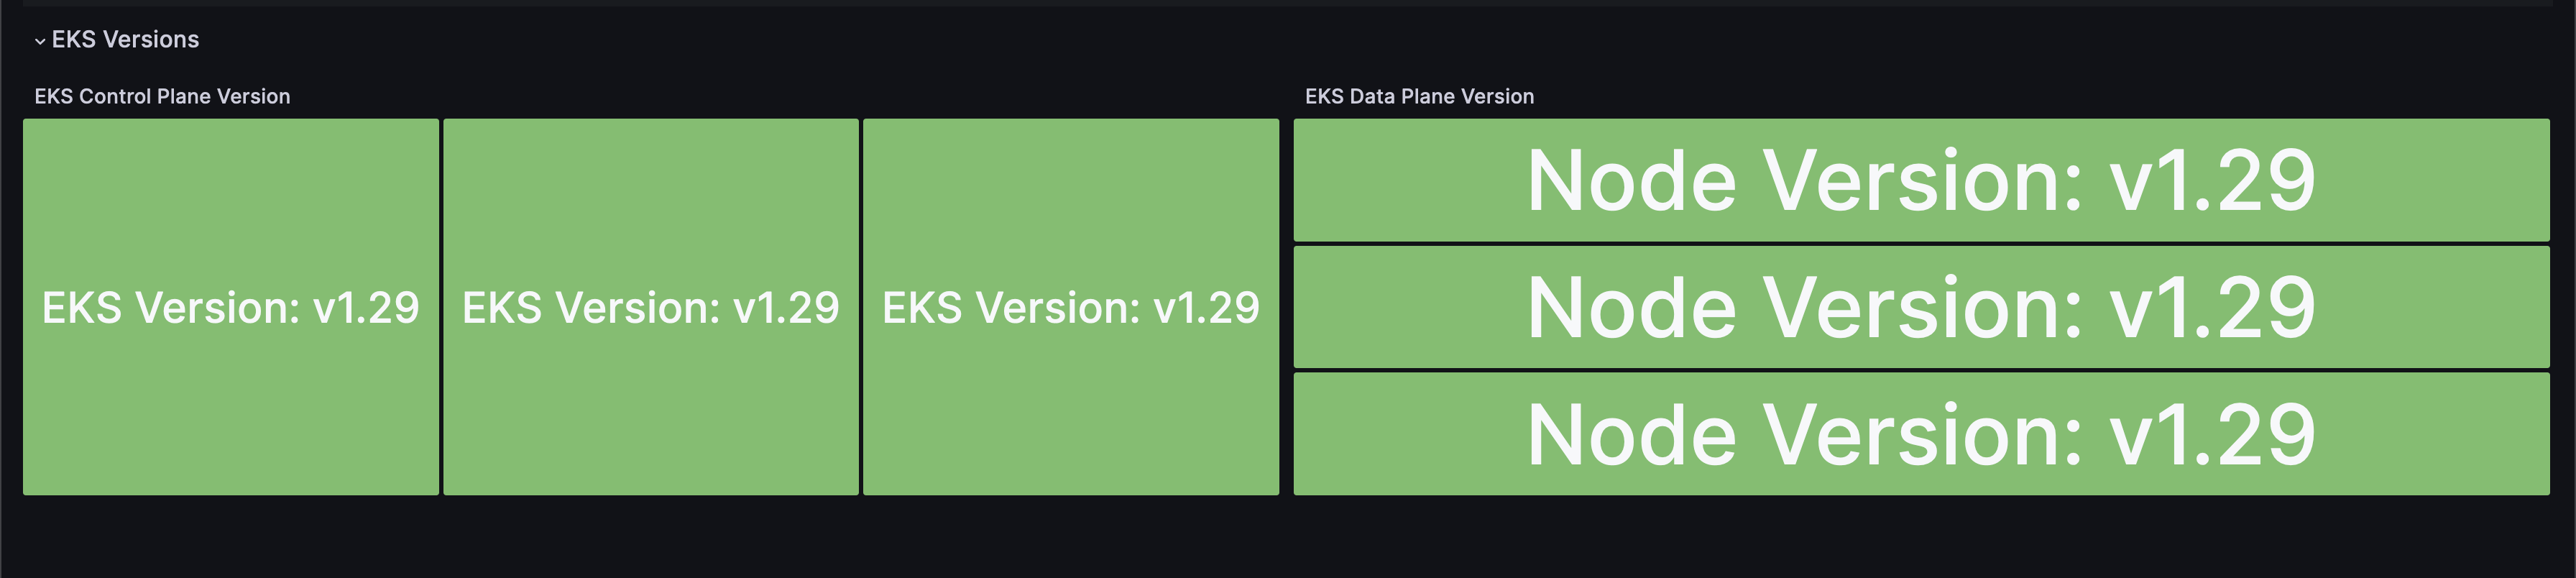
The EKS Control Plane dashboard uses the prometheus data source to create a Grafana dashboard with the bargauge, gauge, stat and timeseries panels.
Data source config
Collector type:
Collector plugins:
Collector config:
Revisions
Upload an updated version of an exported dashboard.json file from Grafana
| Revision | Description | Created | |
|---|---|---|---|
| Download |