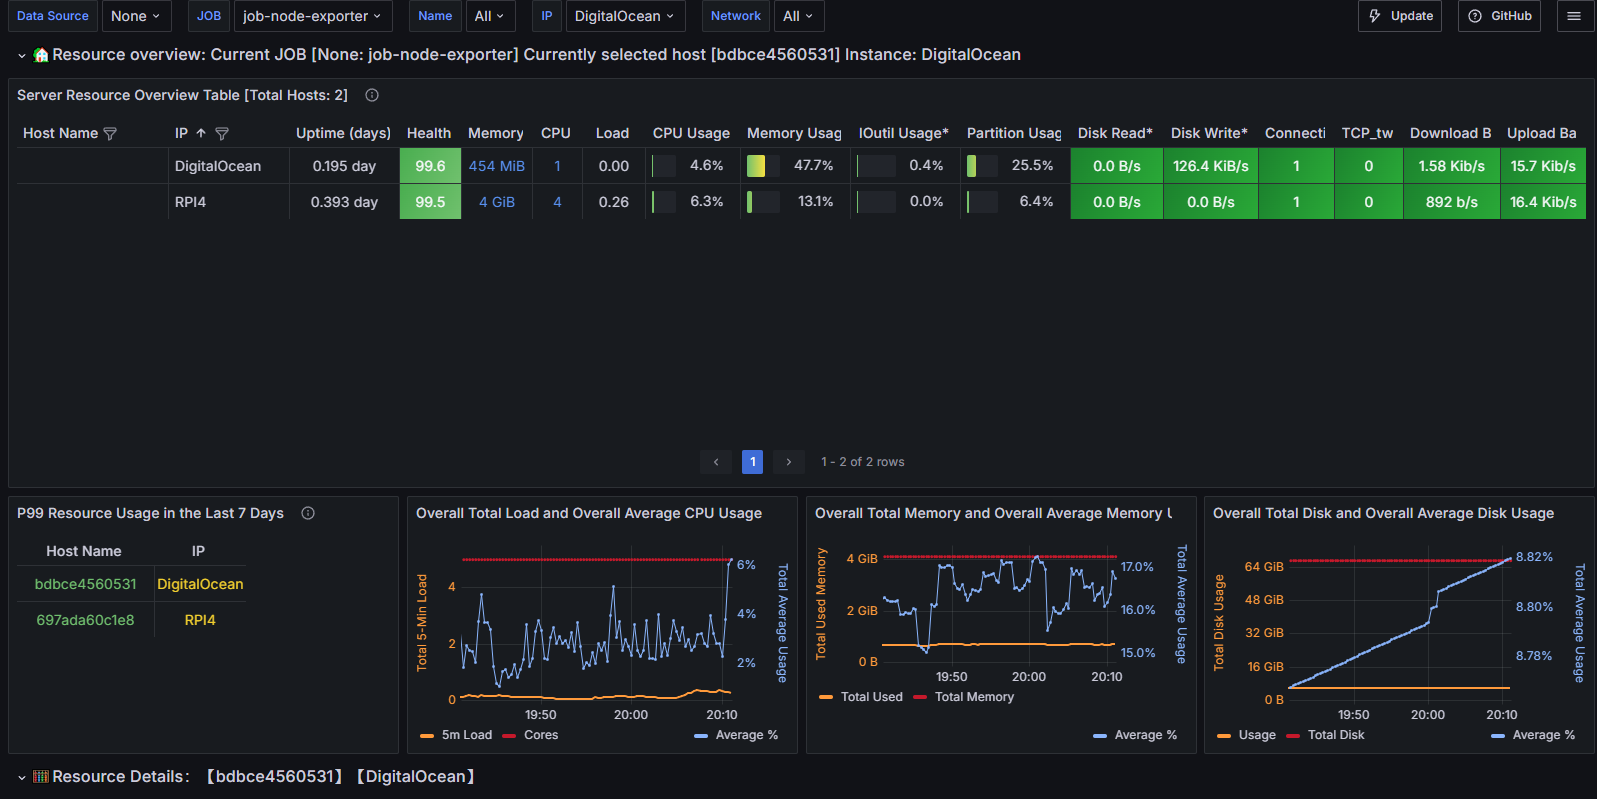
Node Exporter Dashboard 20240520 General JOB Group Edition ENG
[English Version] Updated on 2024.05.22, optimized the display of key metrics. Rebuilt using Grafana10's new style, added the concept of health scores, and added some charts for overall resource consumption information. Includes overall resource display and detailed resource charts: CPU, memory, disk, IO, network monitoring indicators. https://github.com/starsliao/TenSunS
Translate from ID: 16098
Data source config
Collector type:
Collector plugins:
Collector config:
Revisions
Upload an updated version of an exported dashboard.json file from Grafana
| Revision | Description | Created | |
|---|---|---|---|
| Download |
Linux Server
Monitor Linux with Grafana. Easily monitor your Linux deployment with Grafana Cloud's out-of-the-box monitoring solution.
Learn more