Proxmox - Prometheus
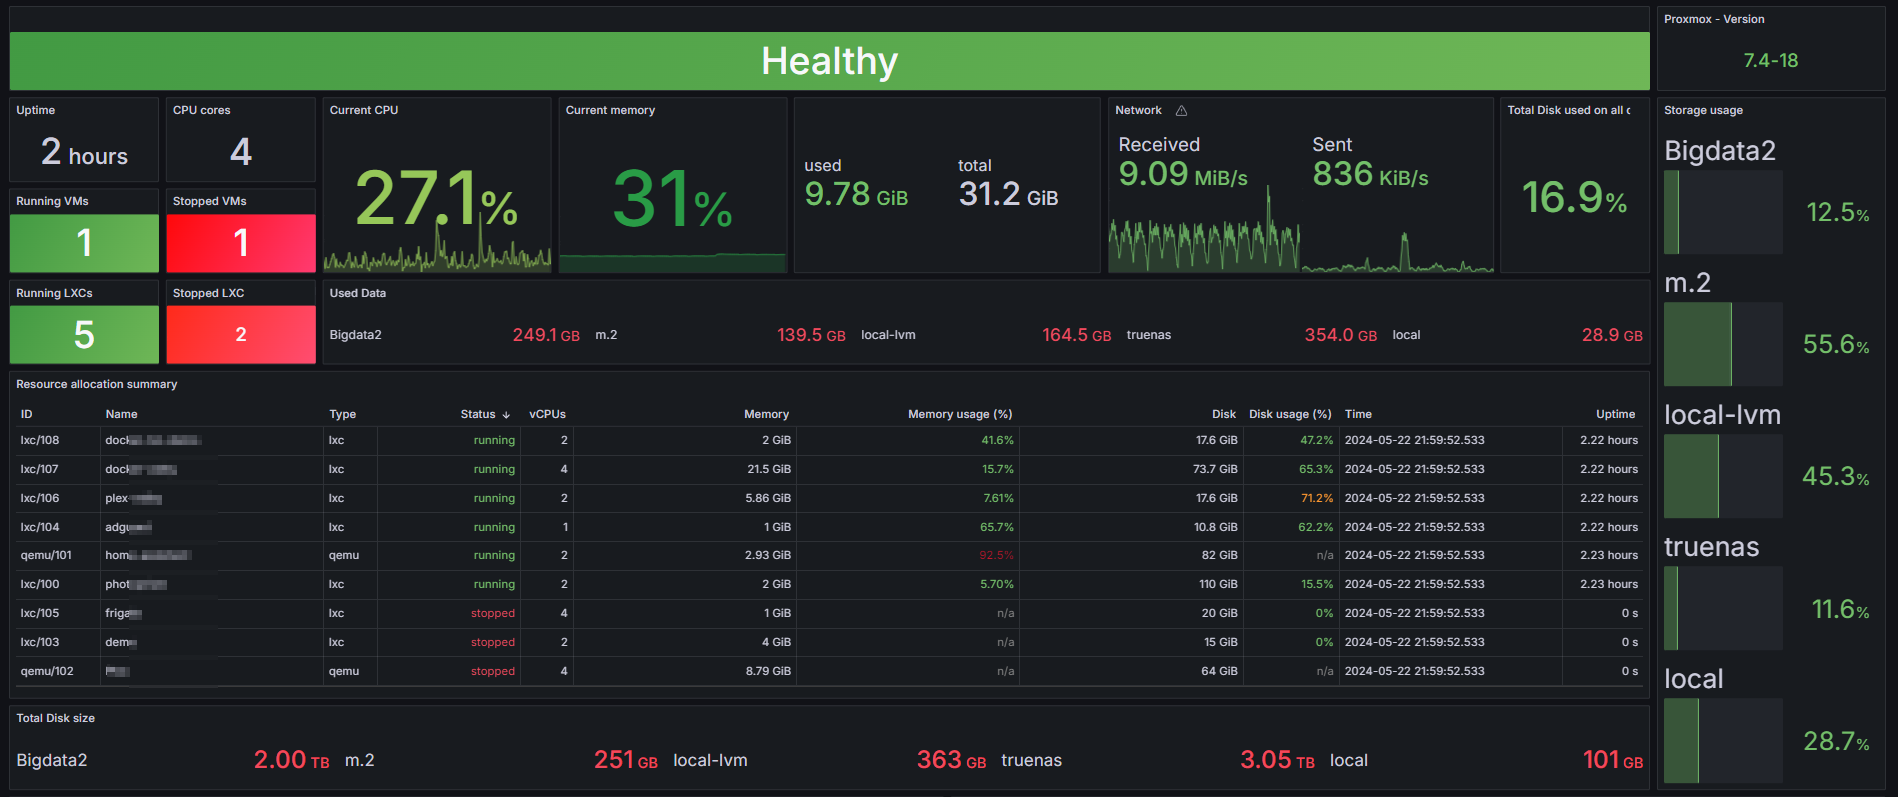
Proxmox Virtual Environment Dashboard
I have taken inspiration from https://grafana.com/grafana/dashboards/10347-proxmox-via-prometheus/
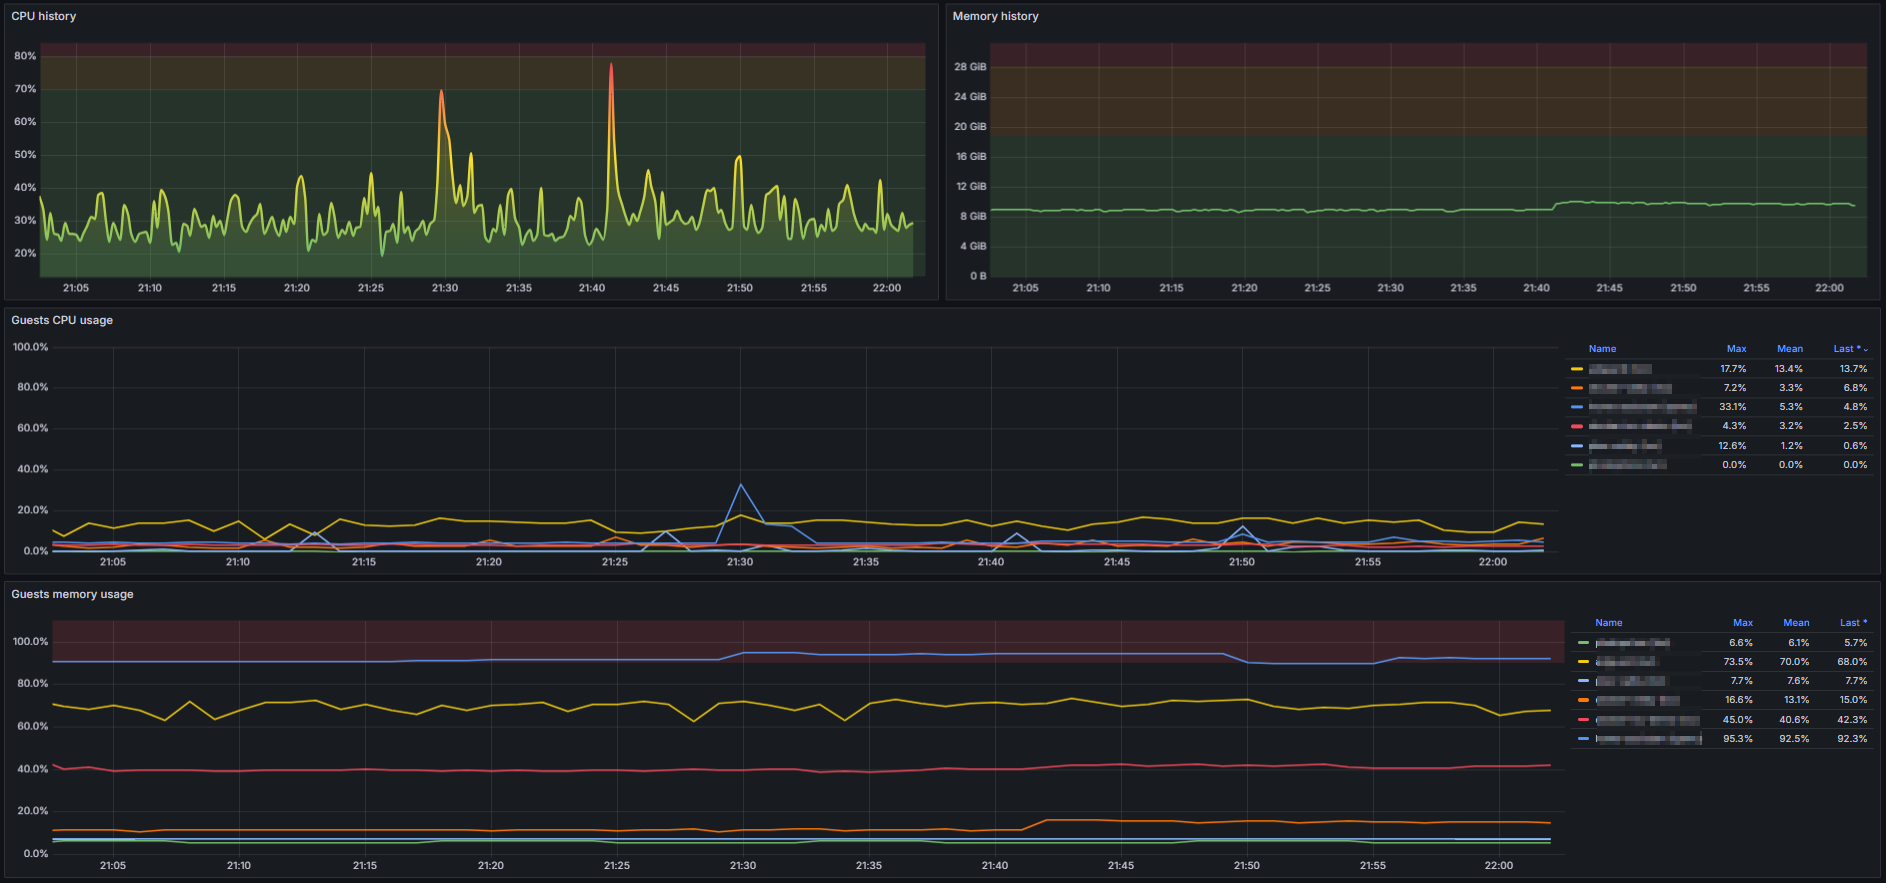
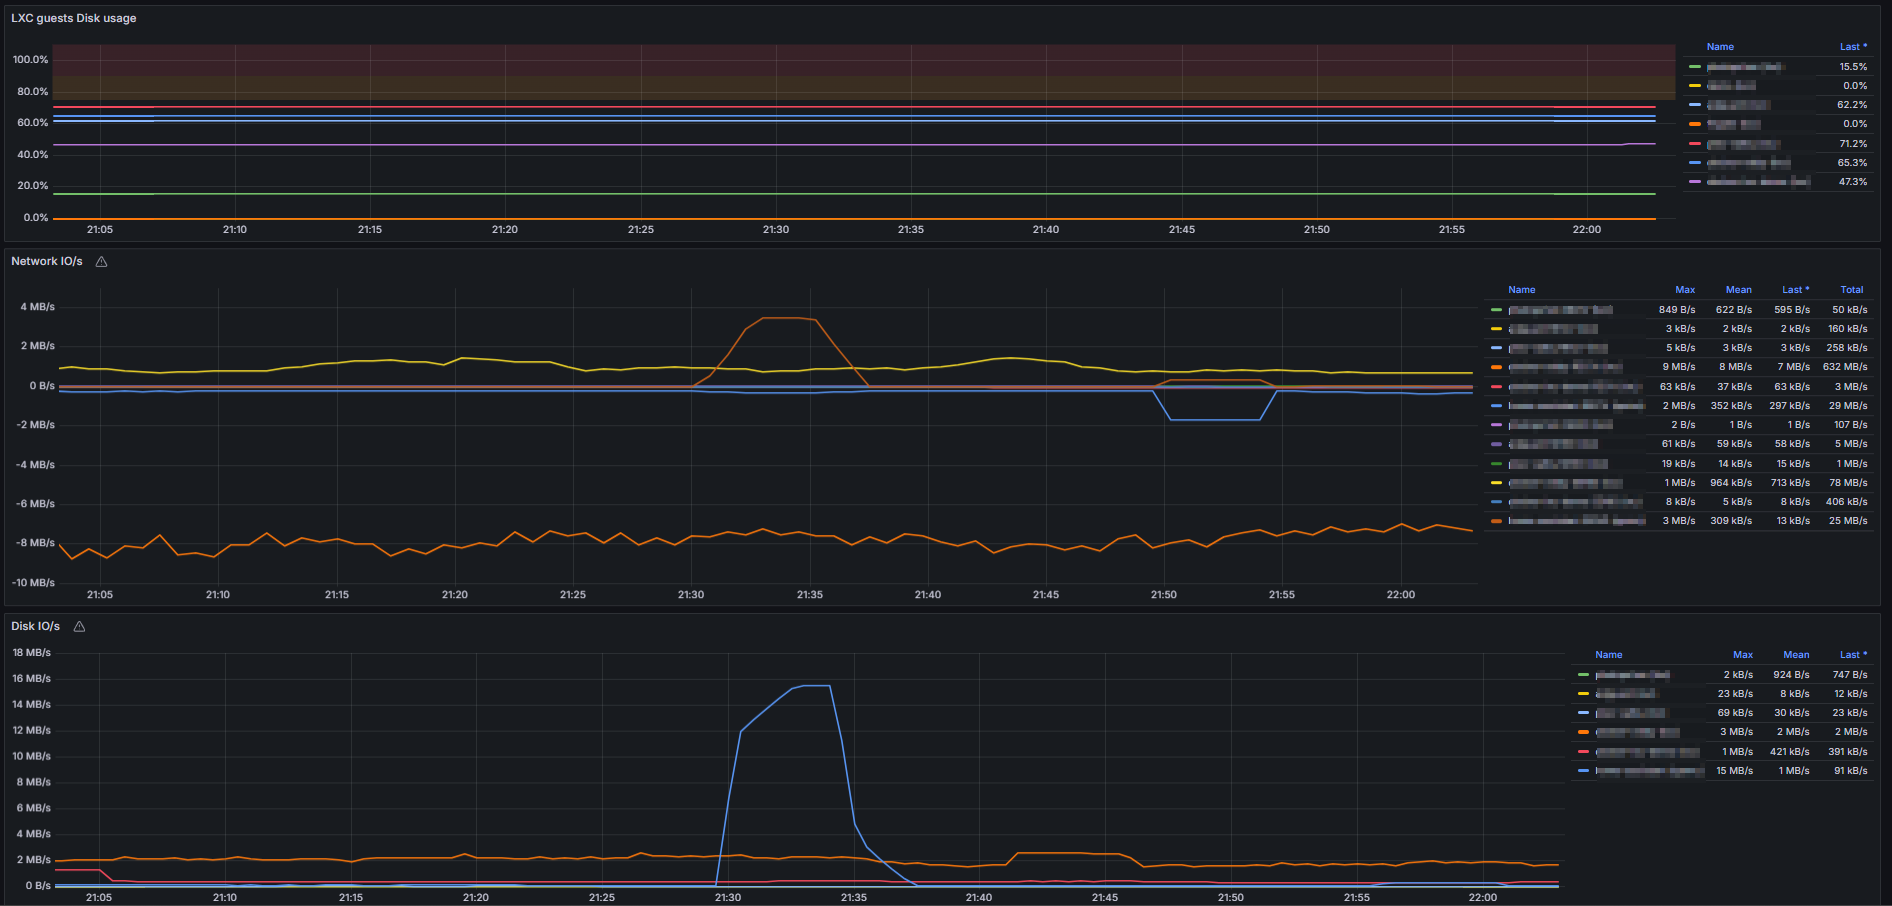
i have updated some of the metrics and added a panels to display health, running and stopped LXC and vms
I have also wirtten a guide on how to setup all the things neeeded to make this dashboard work
https://medium.com/@appletimedk/just-do-grafana-monitor-proxmox-with-prometheus-23312d3e8349
Data source config
Collector type:
Collector plugins:
Collector config:
Revisions
Upload an updated version of an exported dashboard.json file from Grafana
| Revision | Description | Created | |
|---|---|---|---|
| Download |
Metrics Endpoint (Prometheus)
Easily monitor any Prometheus-compatible and publicly accessible metrics URL with Grafana Cloud's out-of-the-box monitoring solution.
Learn more