IBM zCX for z/OS Monitoring
A template to monitor zCX appliances. Copyright IBM Corporation 2020. LICENSE: Apache License, Version 2.0 (http://www.apache.org/licenses/LICENSE-2.0)
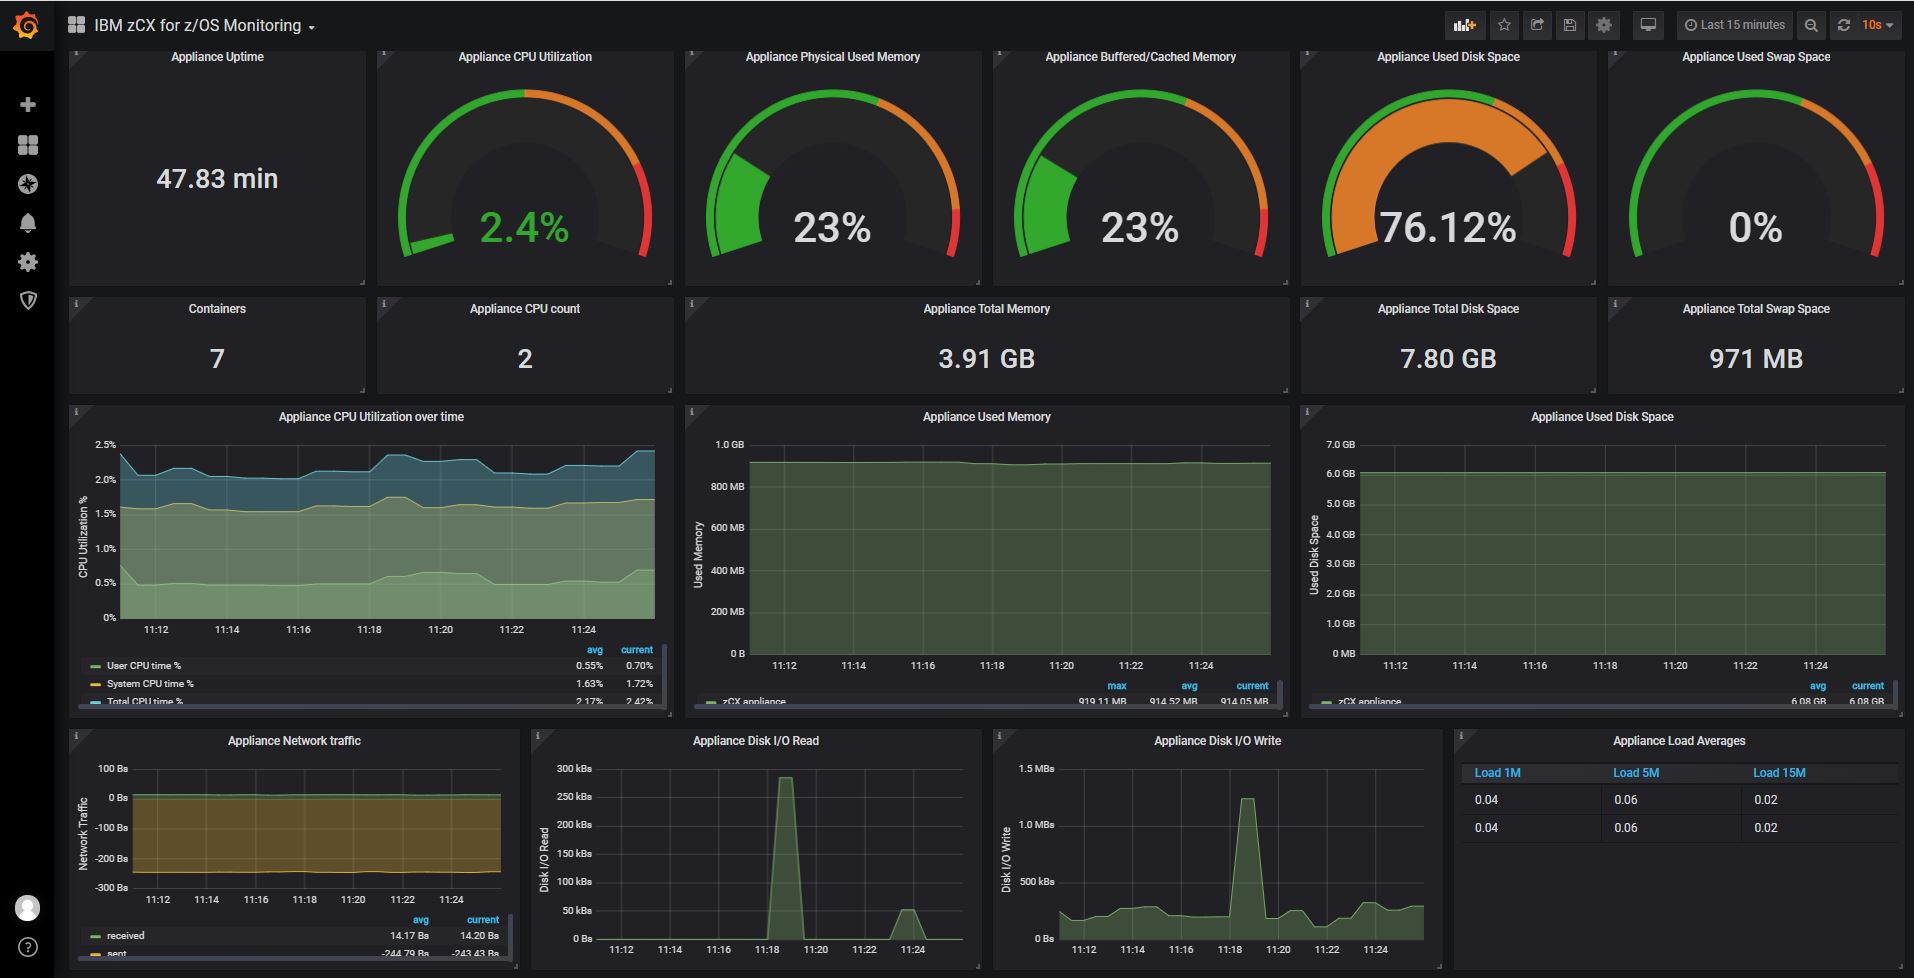
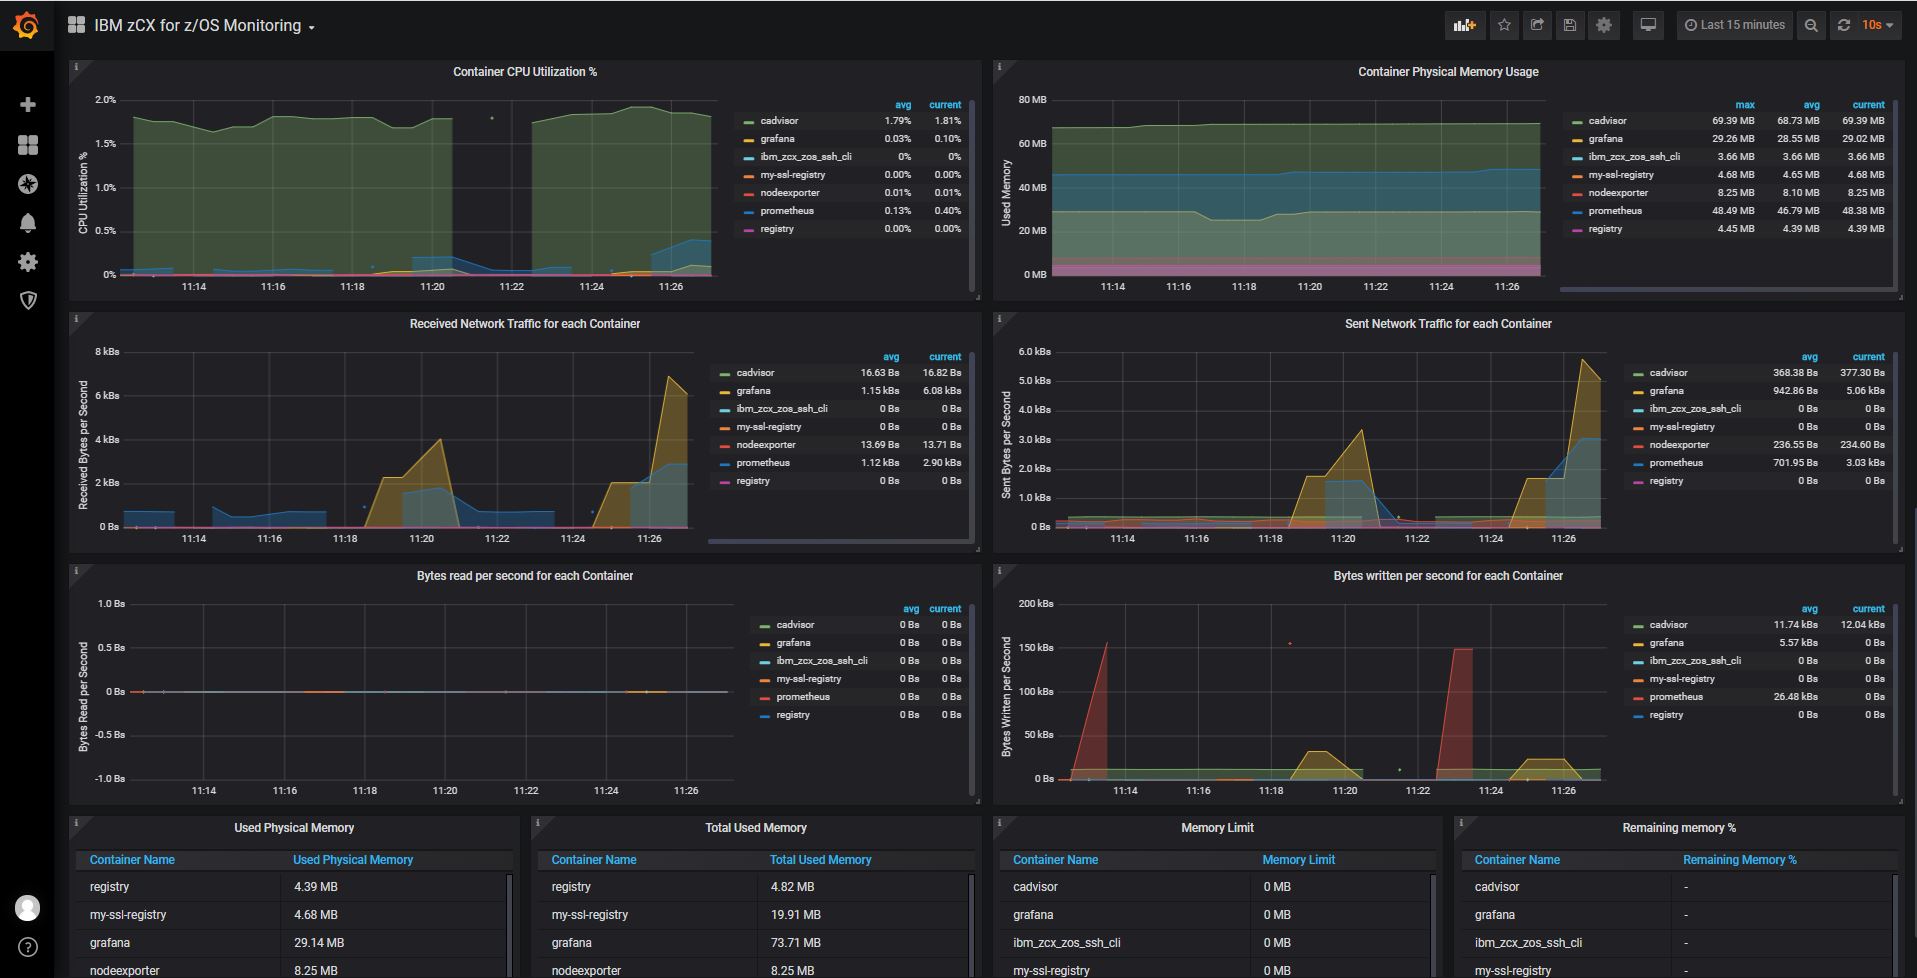
IBM® z/OS® Container Extensions (IBM zCX) makes it possible to integrate Linux on Z applications with z/OS.
This template allows users to monitor zCX appliance and Docker container statistics from one or more zCX appliances by running both Prometheus Node Exporter and cAdvisor on them. This sample dashboard expects a Prometheus data source as its input. To monitor one or more zCX appliances one needs to configure a Prometheus instance to poll all cAdvisor and Prometheus Node Exporter instances.
Before importing this template to Grafana, you will need to add your Prometheus instance that polls zCX appliances as a data source.
© Copyright IBM Corporation 2020. LICENSE: Apache License, Version 2.0 (http://www.apache.org/licenses/LICENSE-2.0)
Data source config
Collector config:
Upload an updated version of an exported dashboard.json file from Grafana
| Revision | Description | Created | |
|---|---|---|---|
| Download |
IBM DB2
Easily monitor your deployment of IBM DB2, a relational database management system designed to store, manage, and retrieve data efficiently, with Grafana Cloud's out-of-the-box monitoring solution.
Learn more