Nmap Dashboard
View and analyze Nmap results with this Grafana Dashboard.
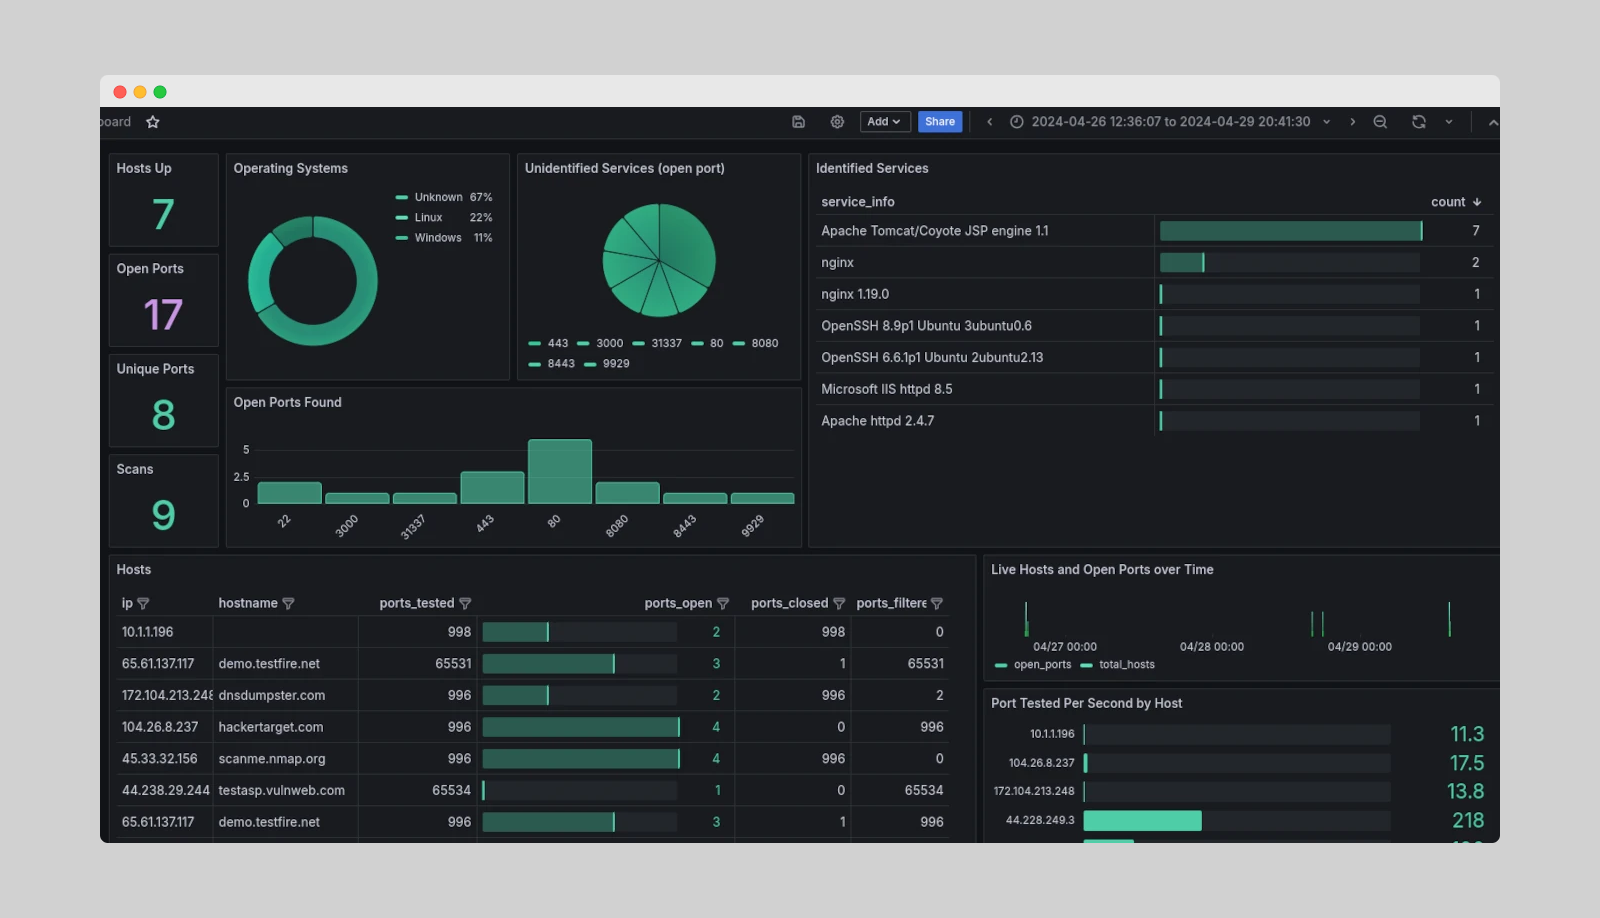
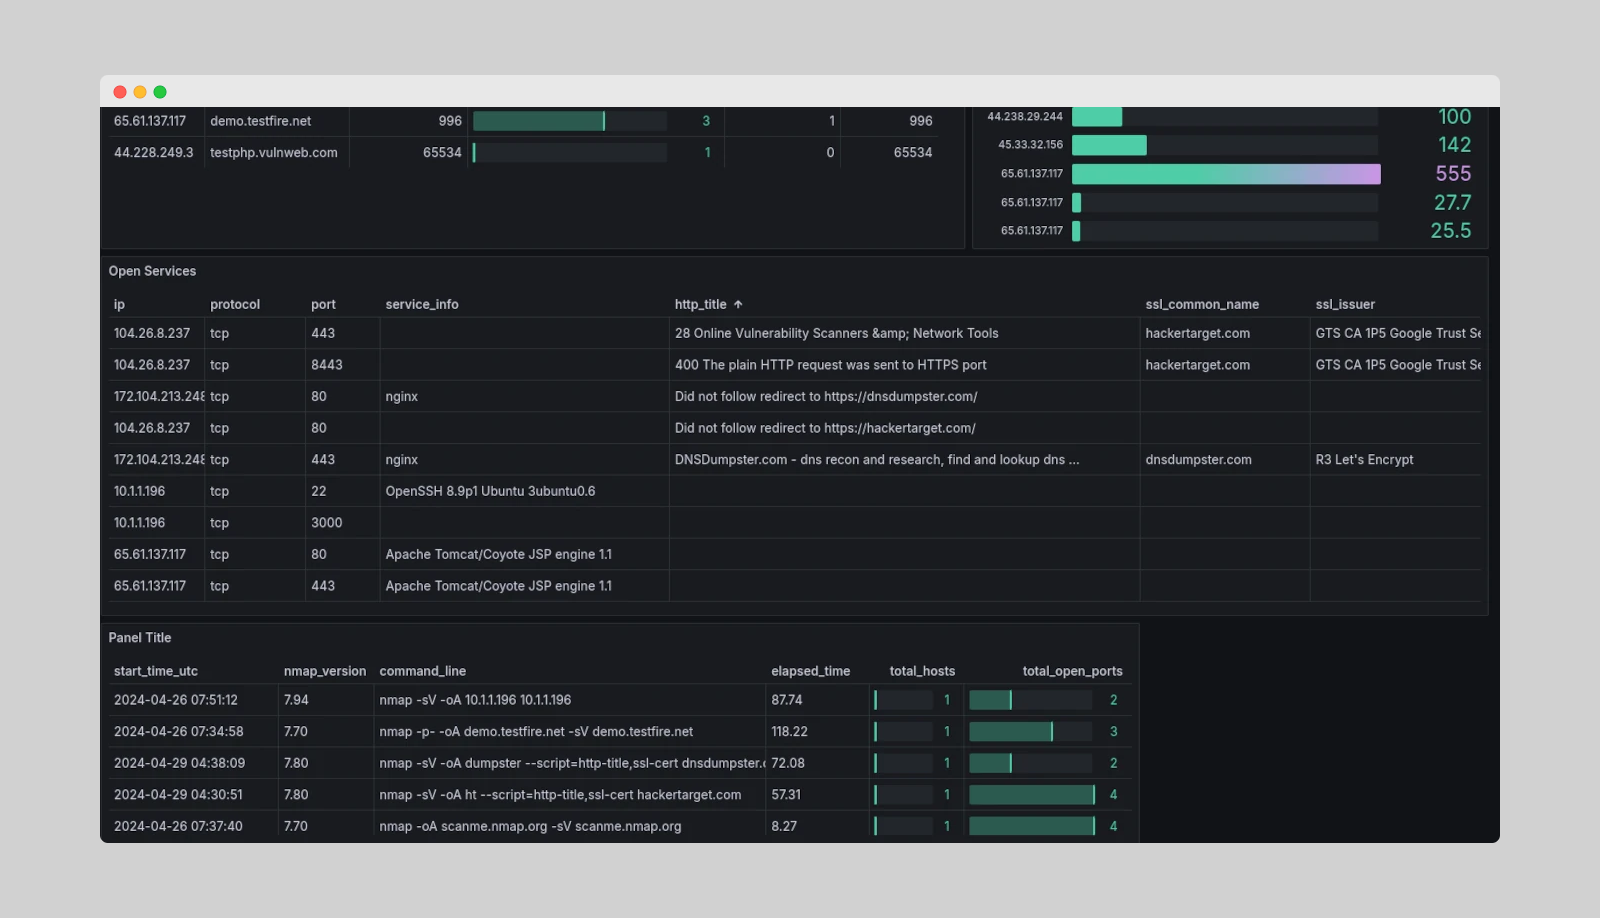
With a visual representation of the Nmap XML data we can get an overview of the network and open services. Customise the dashboard to your specific use case and extend as required.
Get up and running in minutes with Grafana Docker and our easy deployment guide.
Full guide here - https://hackertarget.com/nmap-dashboard-with-grafana/
Data source config
Collector type:
Collector plugins:
Collector config:
Revisions
Upload an updated version of an exported dashboard.json file from Grafana
| Revision | Description | Created | |
|---|---|---|---|
| Download |