OCI Monitoring
OCI Monitoring Dashboard
A Short Introduction
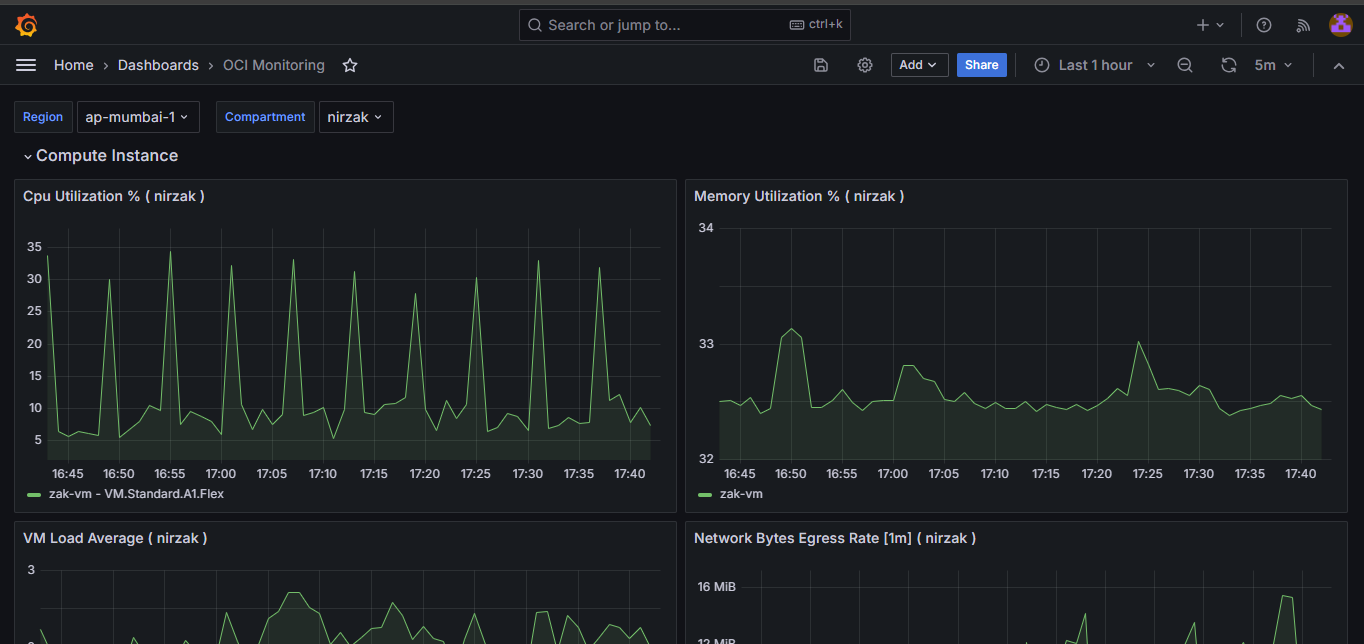
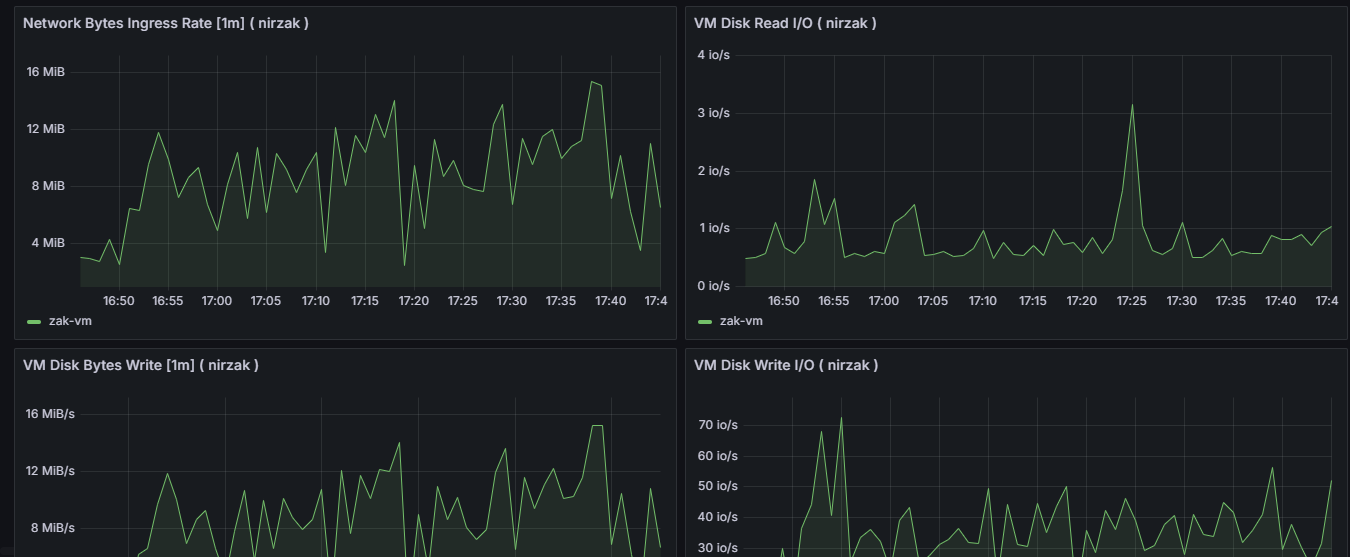
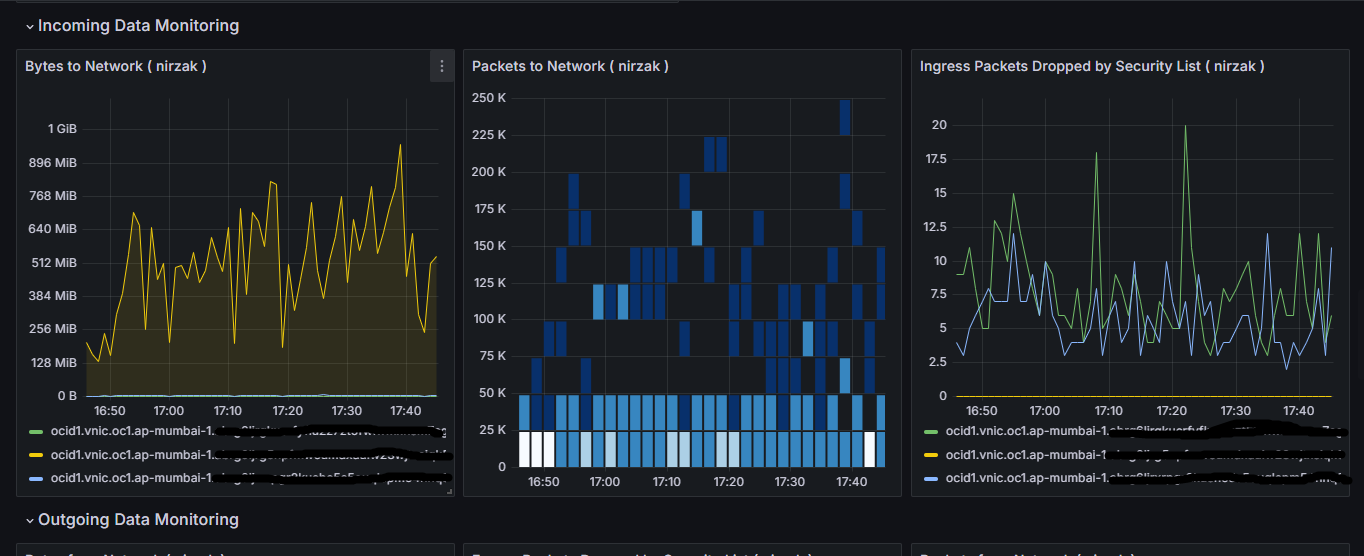
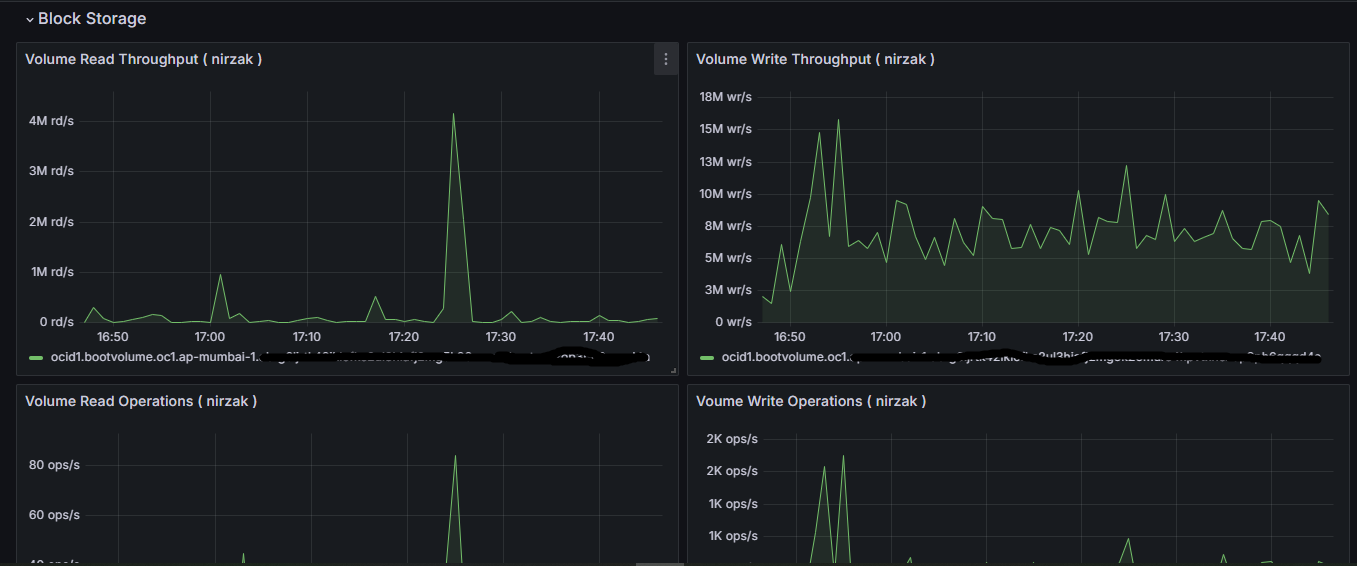
A comprehensive dashboard to monitor Oracle Cloud Infrastructure resources using Oracle's Data Source Plugin. Currently, the dashboard features OCI Compute instances, VCNs, Block Storage and Object Storage related dashboards.
Set up instructions
Before importing the dashboard we first need to set up the Oracle Cloud Infrastructure Metrics plugin to your grafana instance. You can install this plugin from the plugin section of your grafana instance or you can install it using grafana cli by running the following command.
grafana-cli plugins install oci-metrics-datasource
For more information please check here: https://grafana.com/grafana/plugins/oci-metrics-datasource/?tab=installation
To configure the datasource please check Oracle's Doc here: https://github.com/oracle/oci-grafana-metrics/tree/master/docs
Data source config
Collector config:
Upload an updated version of an exported dashboard.json file from Grafana
| Revision | Description | Created | |
|---|---|---|---|
| Download |