Nobl9 Agents
Nobl9 Agents dashboard
Nobl9 Agents Grafana Dashboard
This Grafana dashboard provides a comprehensive overview of your Nobl9 agents’ performance and health. It allows you to visualize key metrics and identify potential issues quickly.
Features:
- Monitors agents’ uptime and connectivity to the Nobl9 platform.
- Tracks query requests and collected SLI metrics points from your data source.
- Identifies trends and anomalies in agent performance metrics.
To enable the SLO Name variable, set the
N9_METRICS_INCLUDE_SLO_LABELSenvironment variable totruewithin the Agent. This feature is available for Nobl9 Agent versionsv0.98.0-betaand above. By default, this setting is disabled due to its potential to significantly increase metrics cardinality.
Requirements:
- A Grafana instance with the Prometheus data source configured.
- The Nobl9 agent Prometheus exporter is enabled with N9_METRICS_PORT and configured to scrape metrics.
- The version of the Nobl9 agent image is greater than or equal to nobl9/agent:0.74.0 or nobl9/agent:0.74.0-beta.
Installation:
- Import the dashboard JSON file into your Grafana instance.
- Configure the Prometheus data source in the dashboard settings to point to your Prometheus server.
- (Optional) Customize the dashboard title, panels, and visualizations to fit your specific needs.
Using the dashboard:
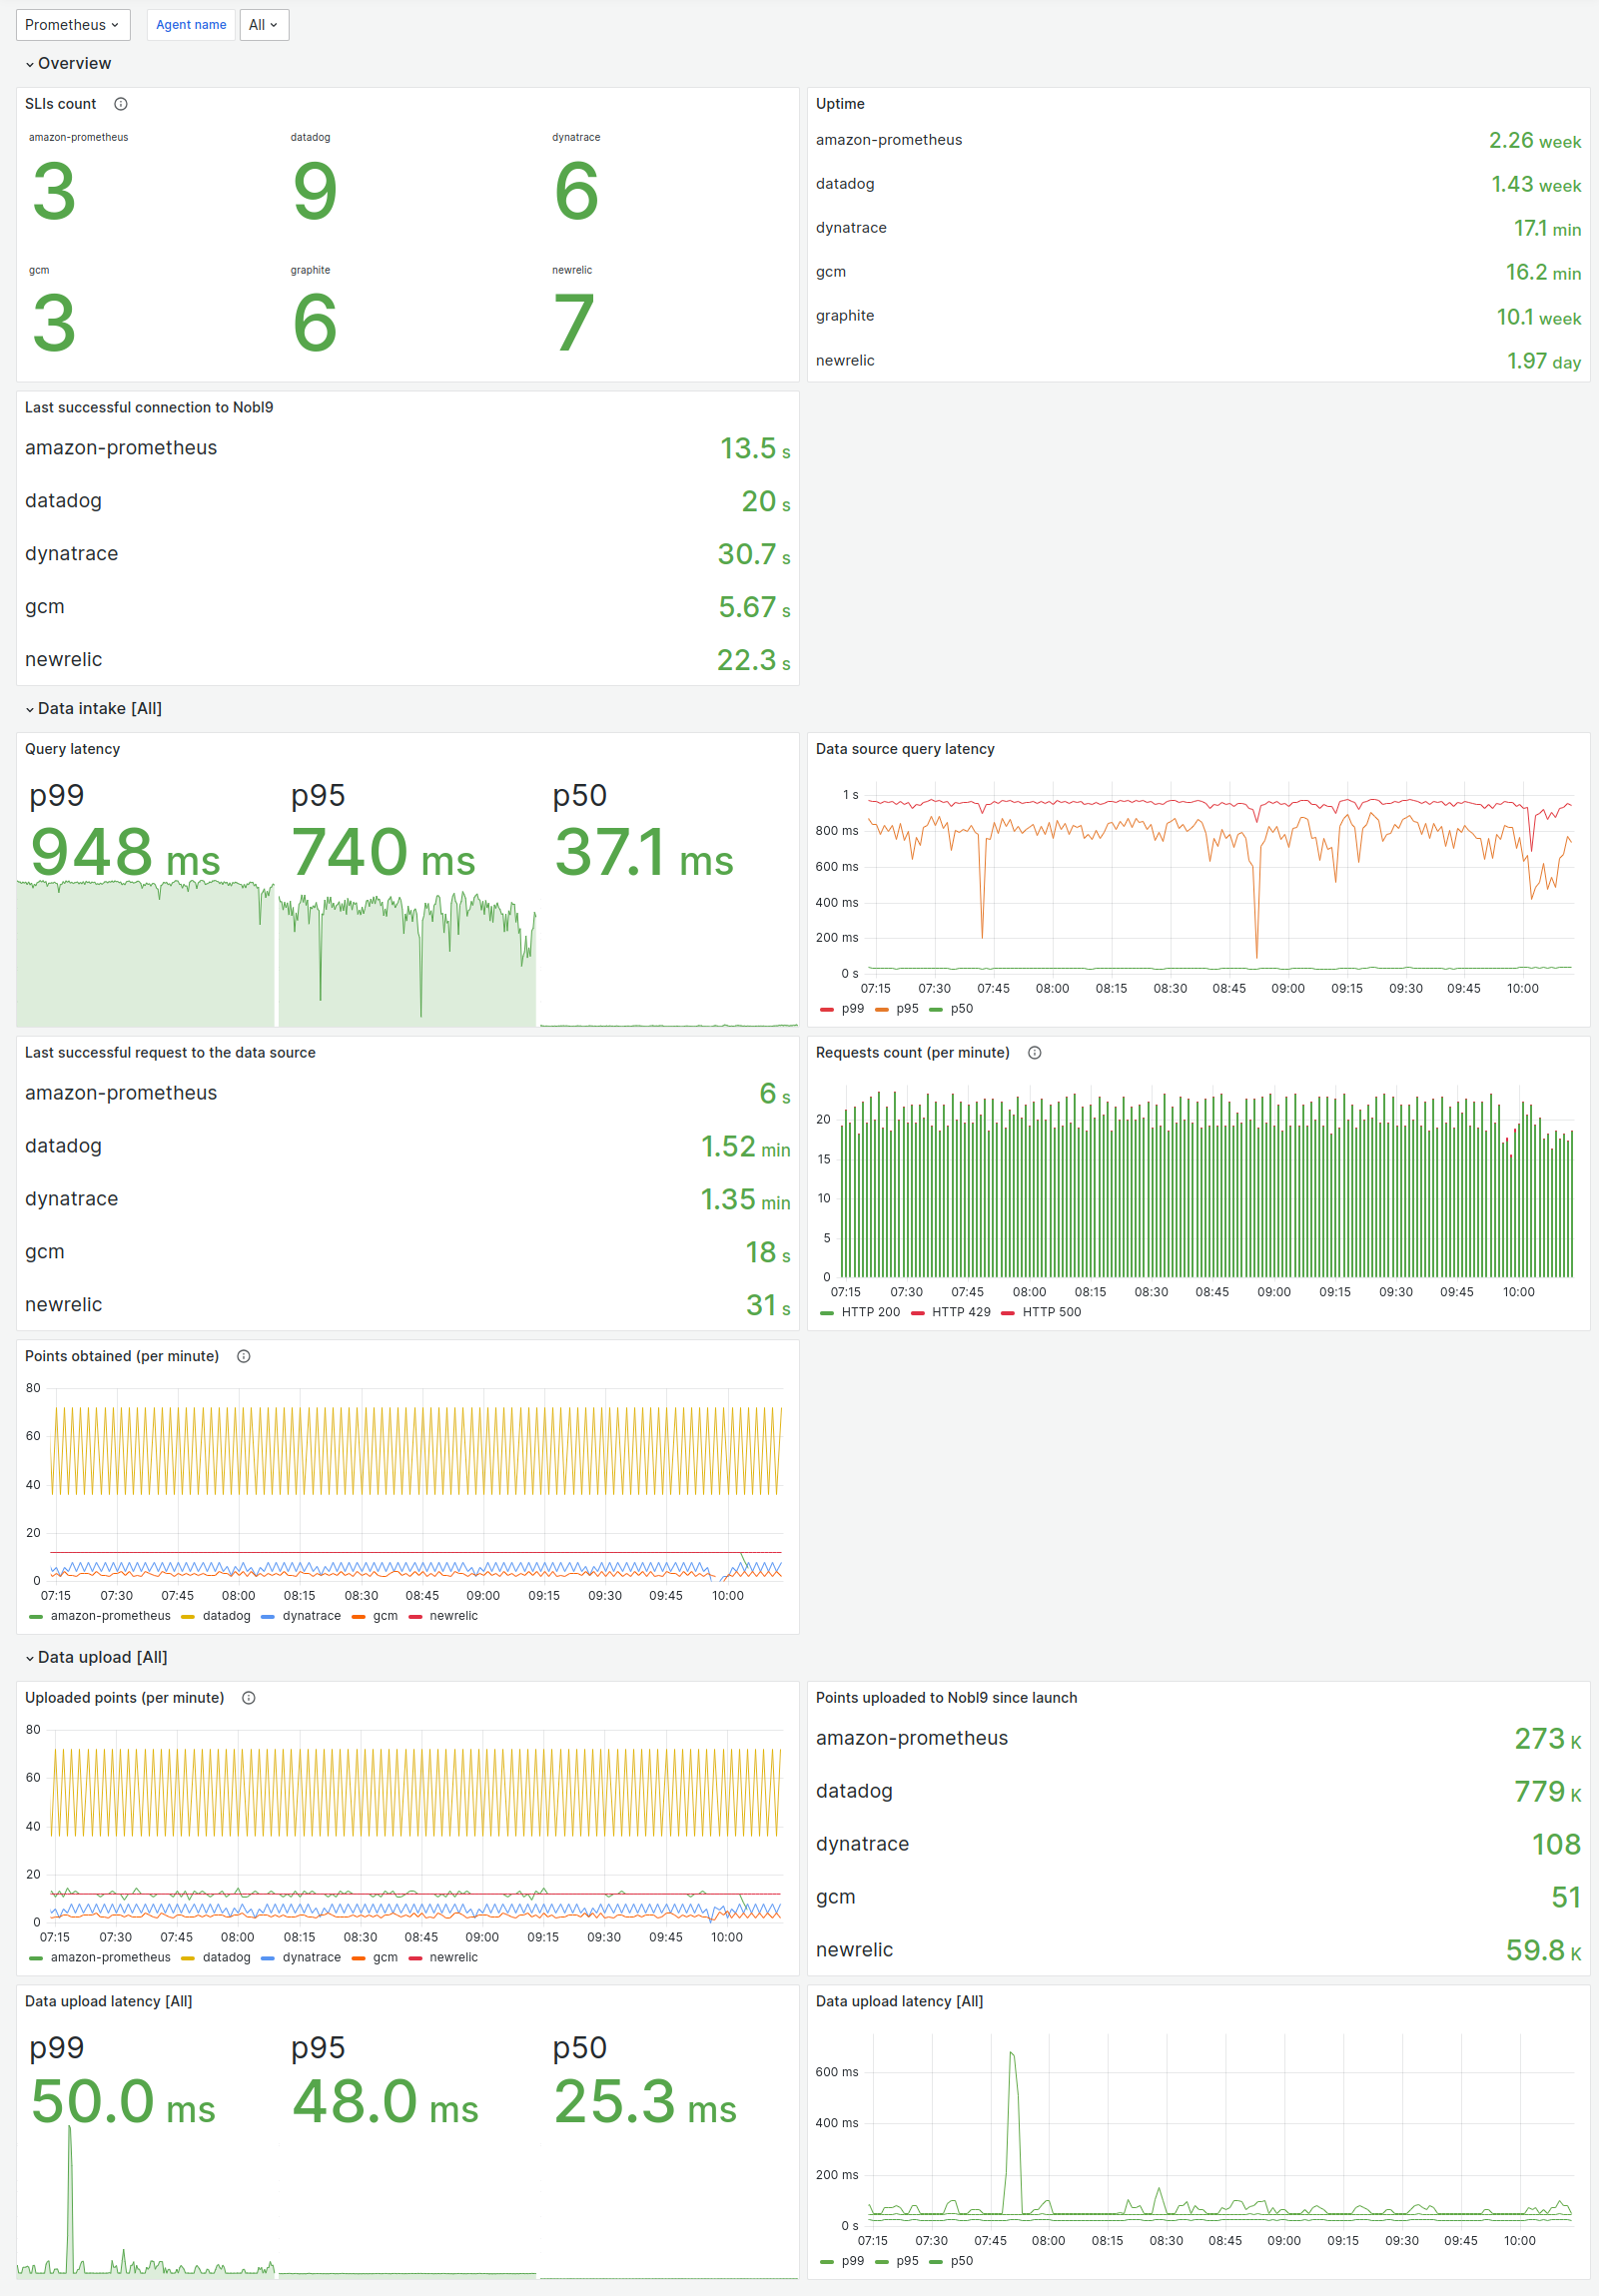
The dashboard incorporates three sections, each focusing on a different aspect of agent performance:
- Overview shows the uptime of your agents over time, the number of running SLIs, and the last connection to the Nobl9 platform.
- Data intake visualizes query latency, points obtained, and successful and failed requests.
- Data upload shows the number of points uploaded and the upload latency.
Alerting:
You can configure alerts in Grafana based on the metrics displayed in the dashboard. This ensures notifications of any critical issues with your agents, such as high resource usage or unexpected downtime.
Support:
If you have any questions or issues related to this dashboard, refer to the Nobl9 documentation or contact Nobl9 support.
License:
This dashboard is distributed under the Apache License 2.0. See the license file for more information.
Data source config
Collector config:
Upload an updated version of an exported dashboard.json file from Grafana
| Revision | Description | Created | |
|---|---|---|---|
| Download |