logs-count
Thank you!! Grafana Labs. Over the years, we've used Grafana in the center to gather our monitoring data from numerous tools. Grafana provides several customizable ways to create or use existing dashboards for visualizing and arranging data. For the best practice, the#development team can evaluate and troubleshoot issues with metrics and logs from Prometheus and Loki and some additional data sources for our circumstances.
I've spent the last four years working with Grafana with various connected technologies, including Prometheus, Loki, CloudWatch, a PostgreSQL data source, Kubernetes event exporters, etc. Also, I would like you to eliminate much of the manual effort and several mechanisms I have followed for years.
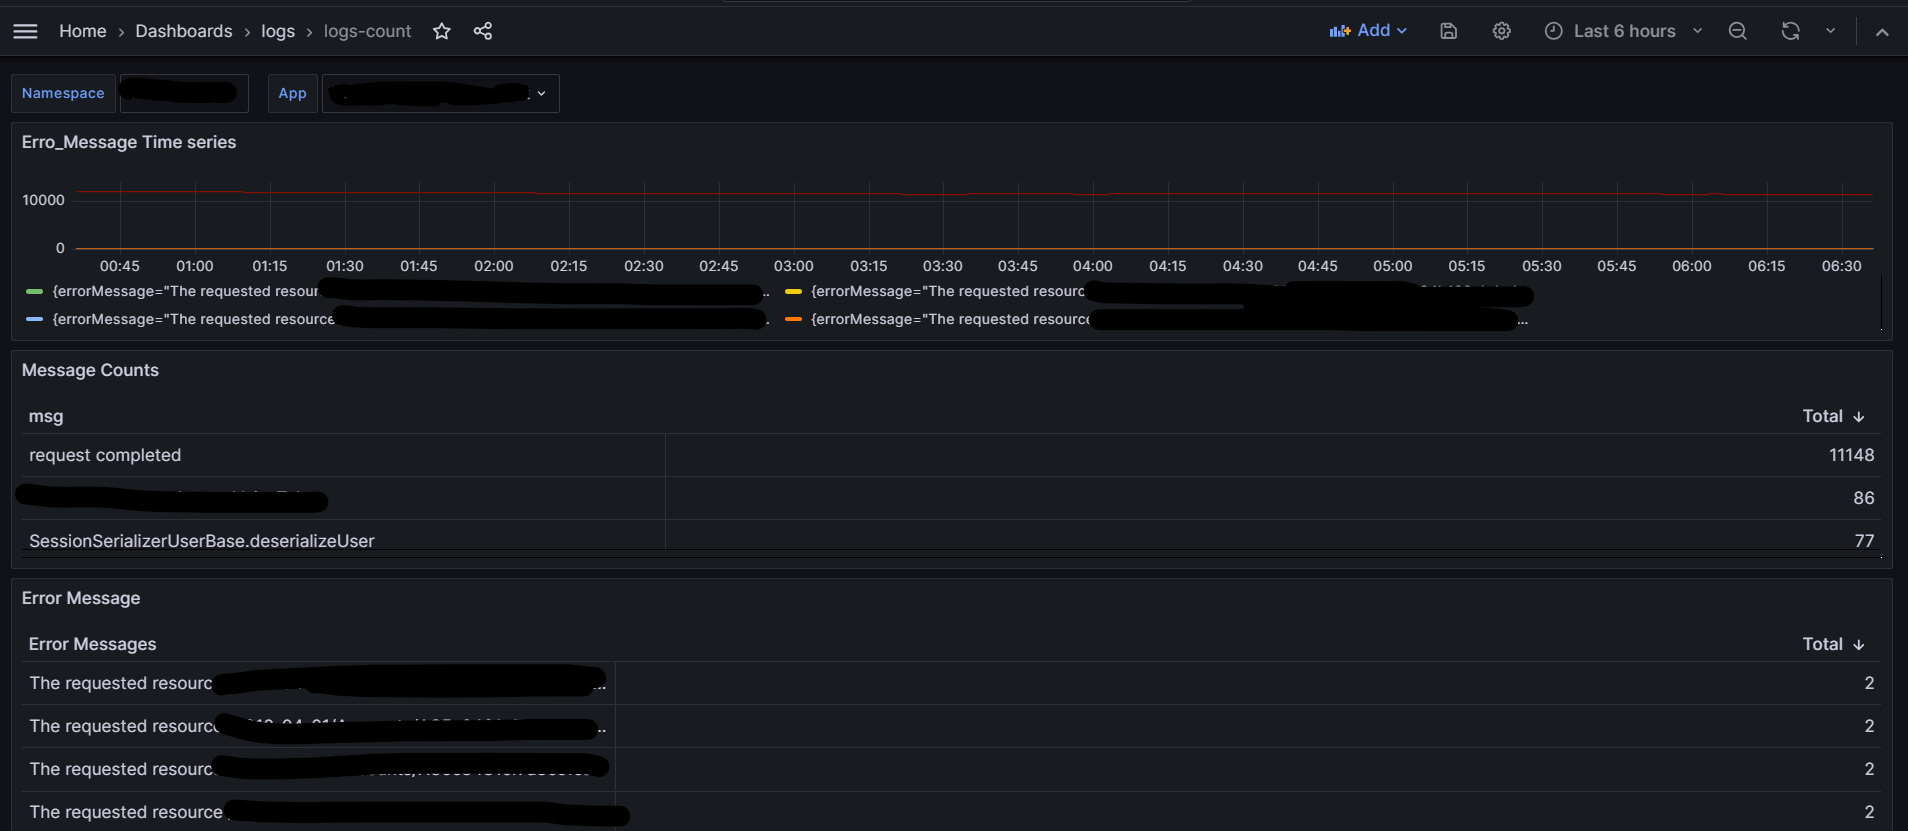
I created a custom dashboard that works nicely using Loki as the data source to display log "messages" and "error messages" from your application logs. So, it was quickly built using key pairs, with one side representing message categories and the other representing message counts. So we can use this dashboard more and more to set up alerts for some error messages that we receive, to find out what errors are being thrown on applications, and to reduce overhead by not having to search and route error logs all the time. Instead, we can catch the error in the table using this dashboard. It is designed for a microservice application, with log labels that include "message" and "error message.".
Data source config
Collector config:
Upload an updated version of an exported dashboard.json file from Grafana
| Revision | Description | Created | |
|---|---|---|---|
| Download |
Grafana Loki (self-hosted)
Easily monitor Grafana Loki (self-hosted), a horizontally scalable, highly available, multi-tenant log aggregation system inspired by Prometheus, with Grafana Cloud's out-of-the-box monitoring solution.
Learn more