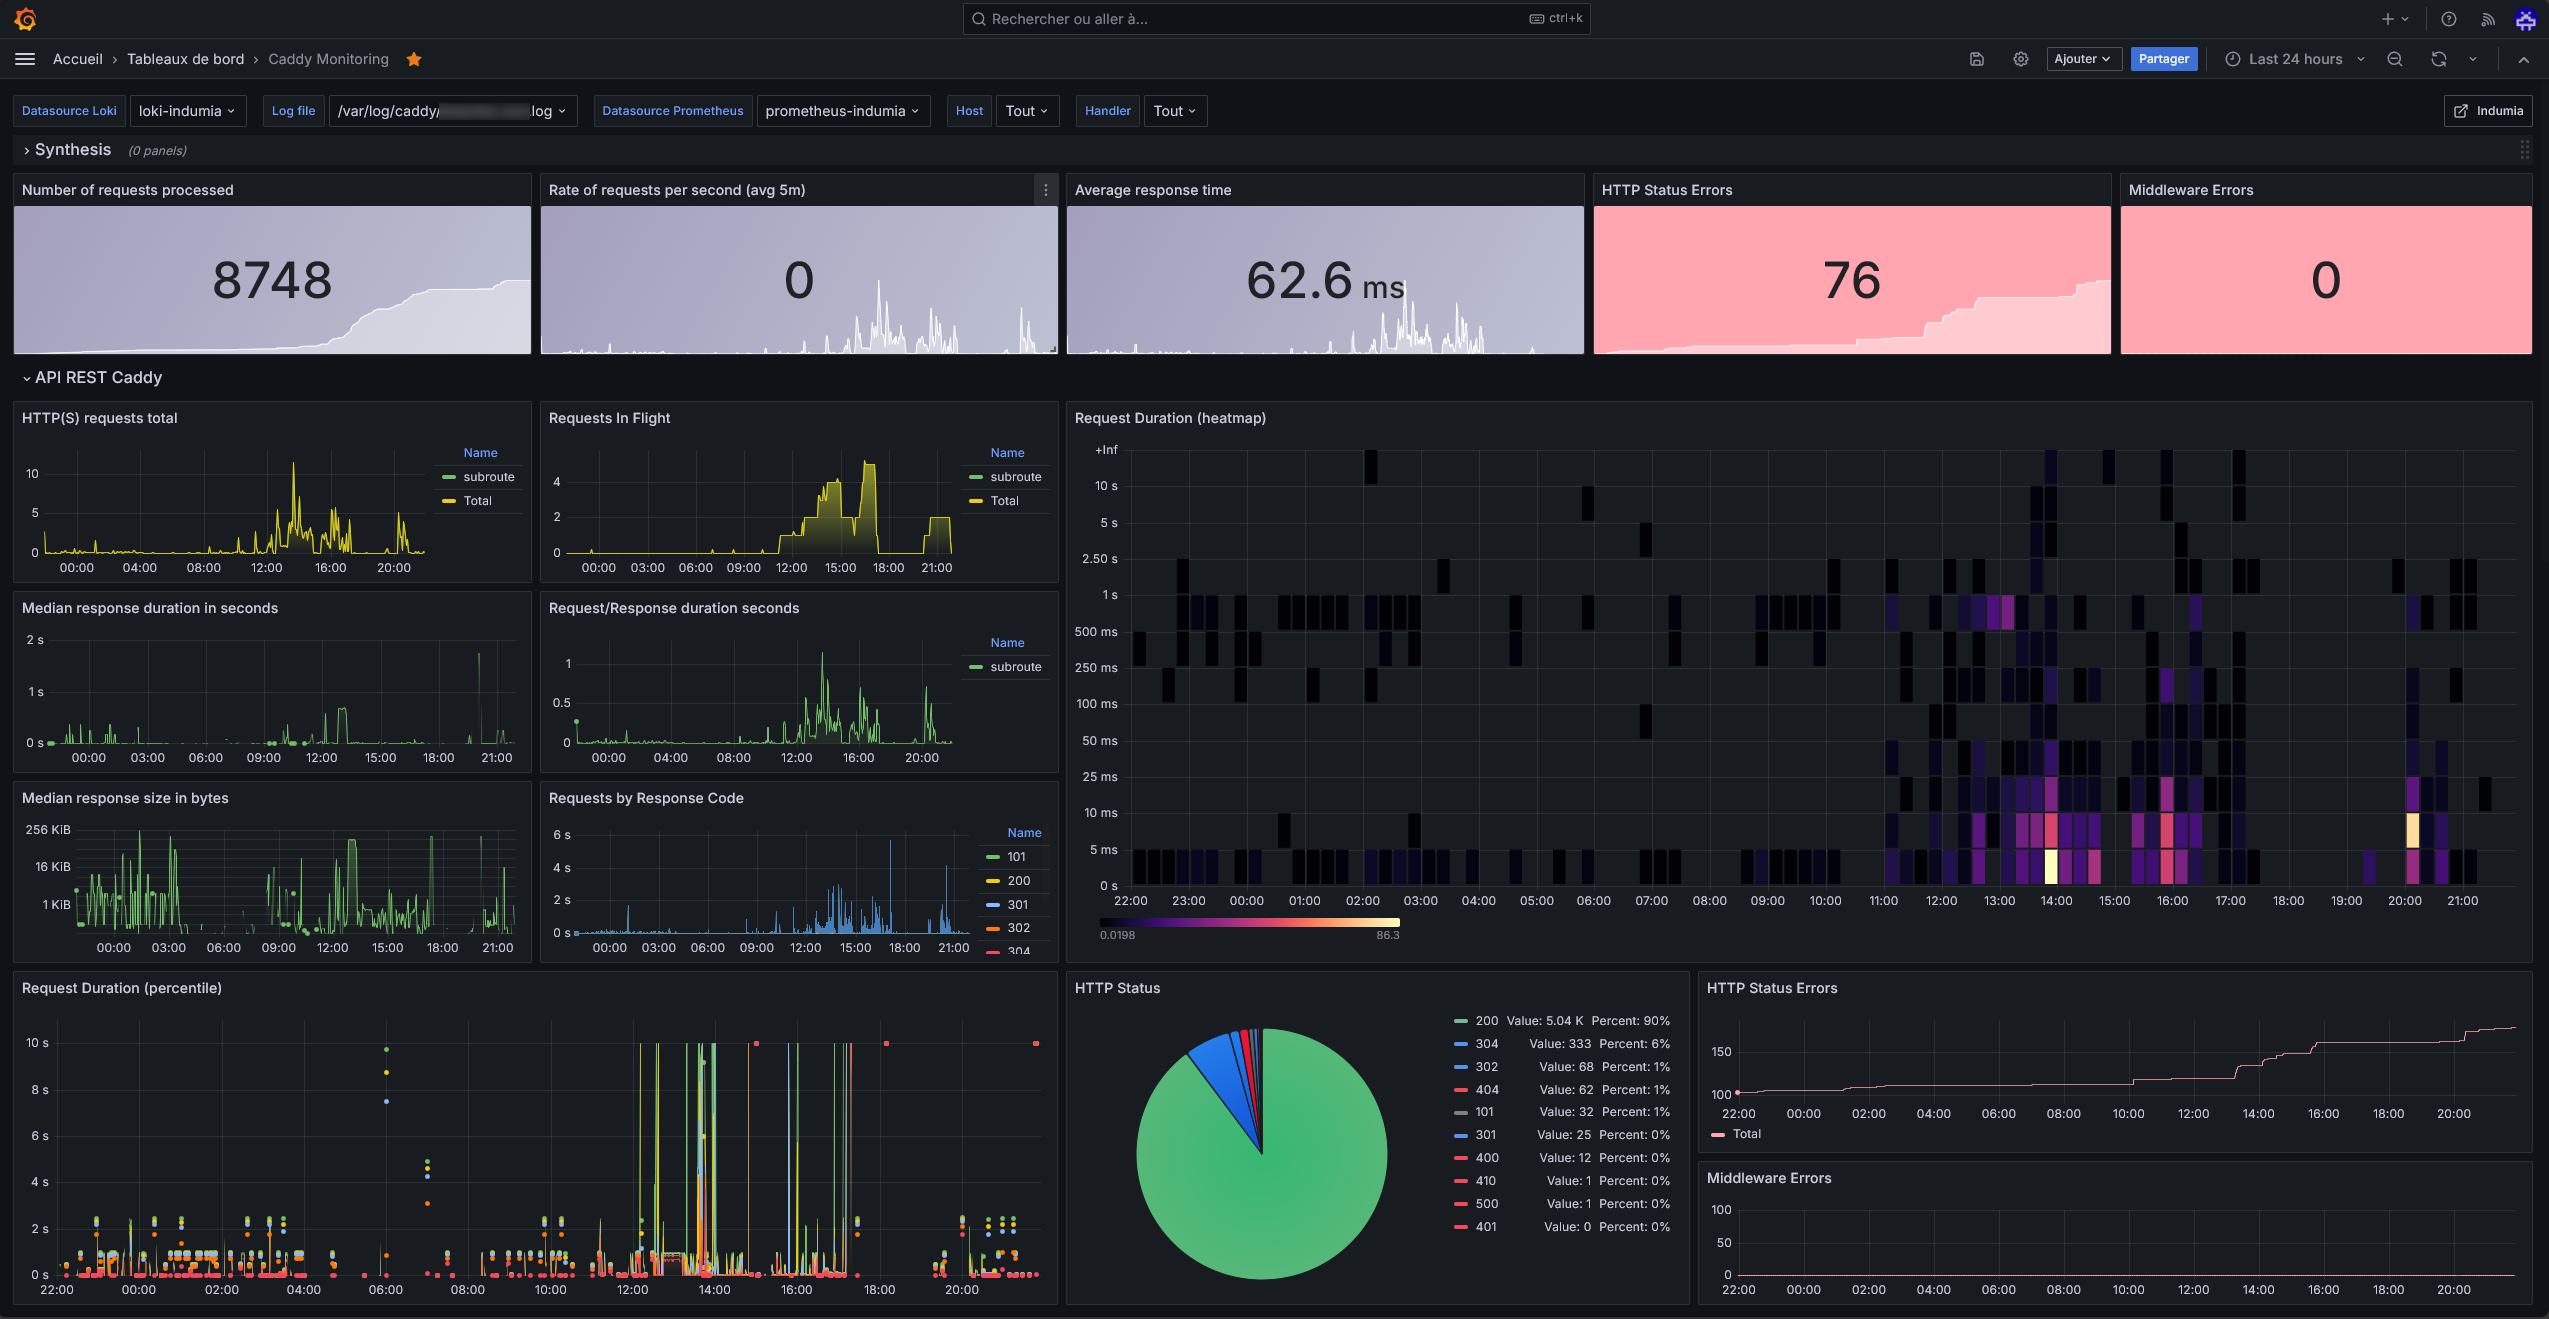
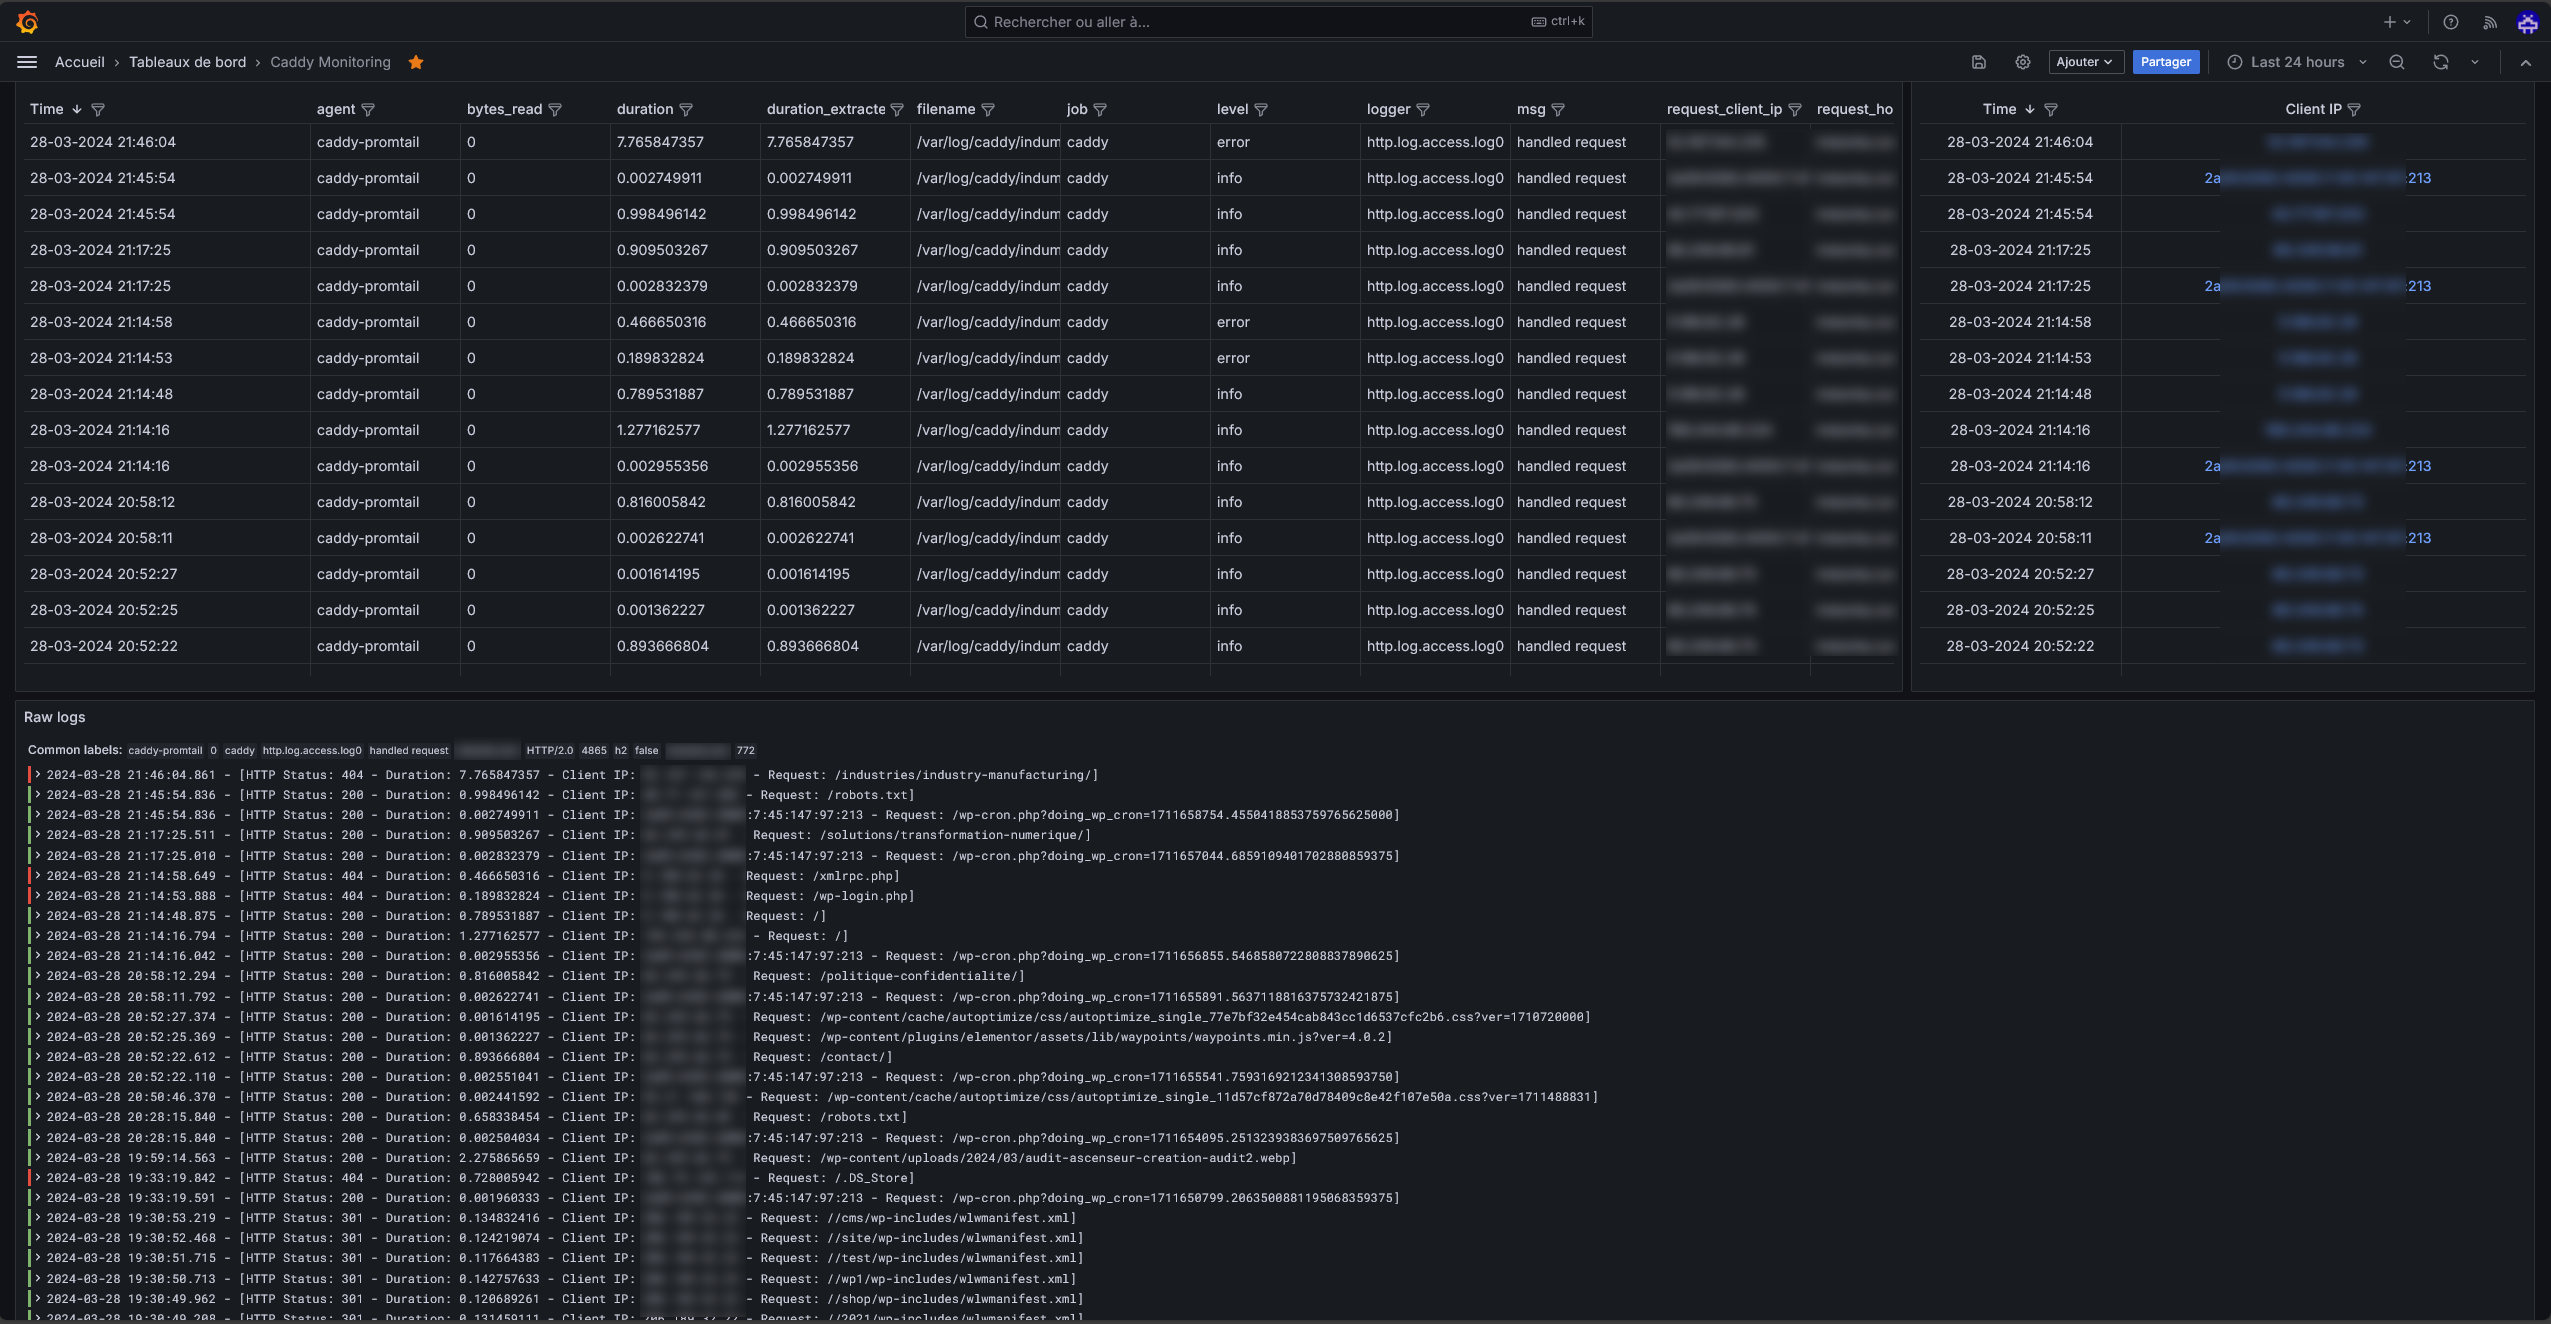
Caddy Monitoring
Monitoring Caddy Server with Grafana (Prometheus + Loki)
For more information on setting up Prometheus and Loki: https://github.com/Malfhas/caddy-grafana
I hope this will be useful to others.
Data source config
Collector type:
Collector plugins:
Collector config:
Revisions
Upload an updated version of an exported dashboard.json file from Grafana
| Revision | Description | Created | |
|---|---|---|---|
| Download |
Caddy
Easily monitor Caddy, an open source web server written in Go, with Grafana Cloud's out-of-the-box monitoring solution.
Learn more