Telegraf - system metrics(InfluxDB 2.7+Telegraf 1.30)
InfluxDB dashboards for telegraf metrics
This Grafana dashboard is an update version of https://grafana.com/grafana/dashboards/5955-telegraf-system-metrics/.
You can visualize the following data from it:
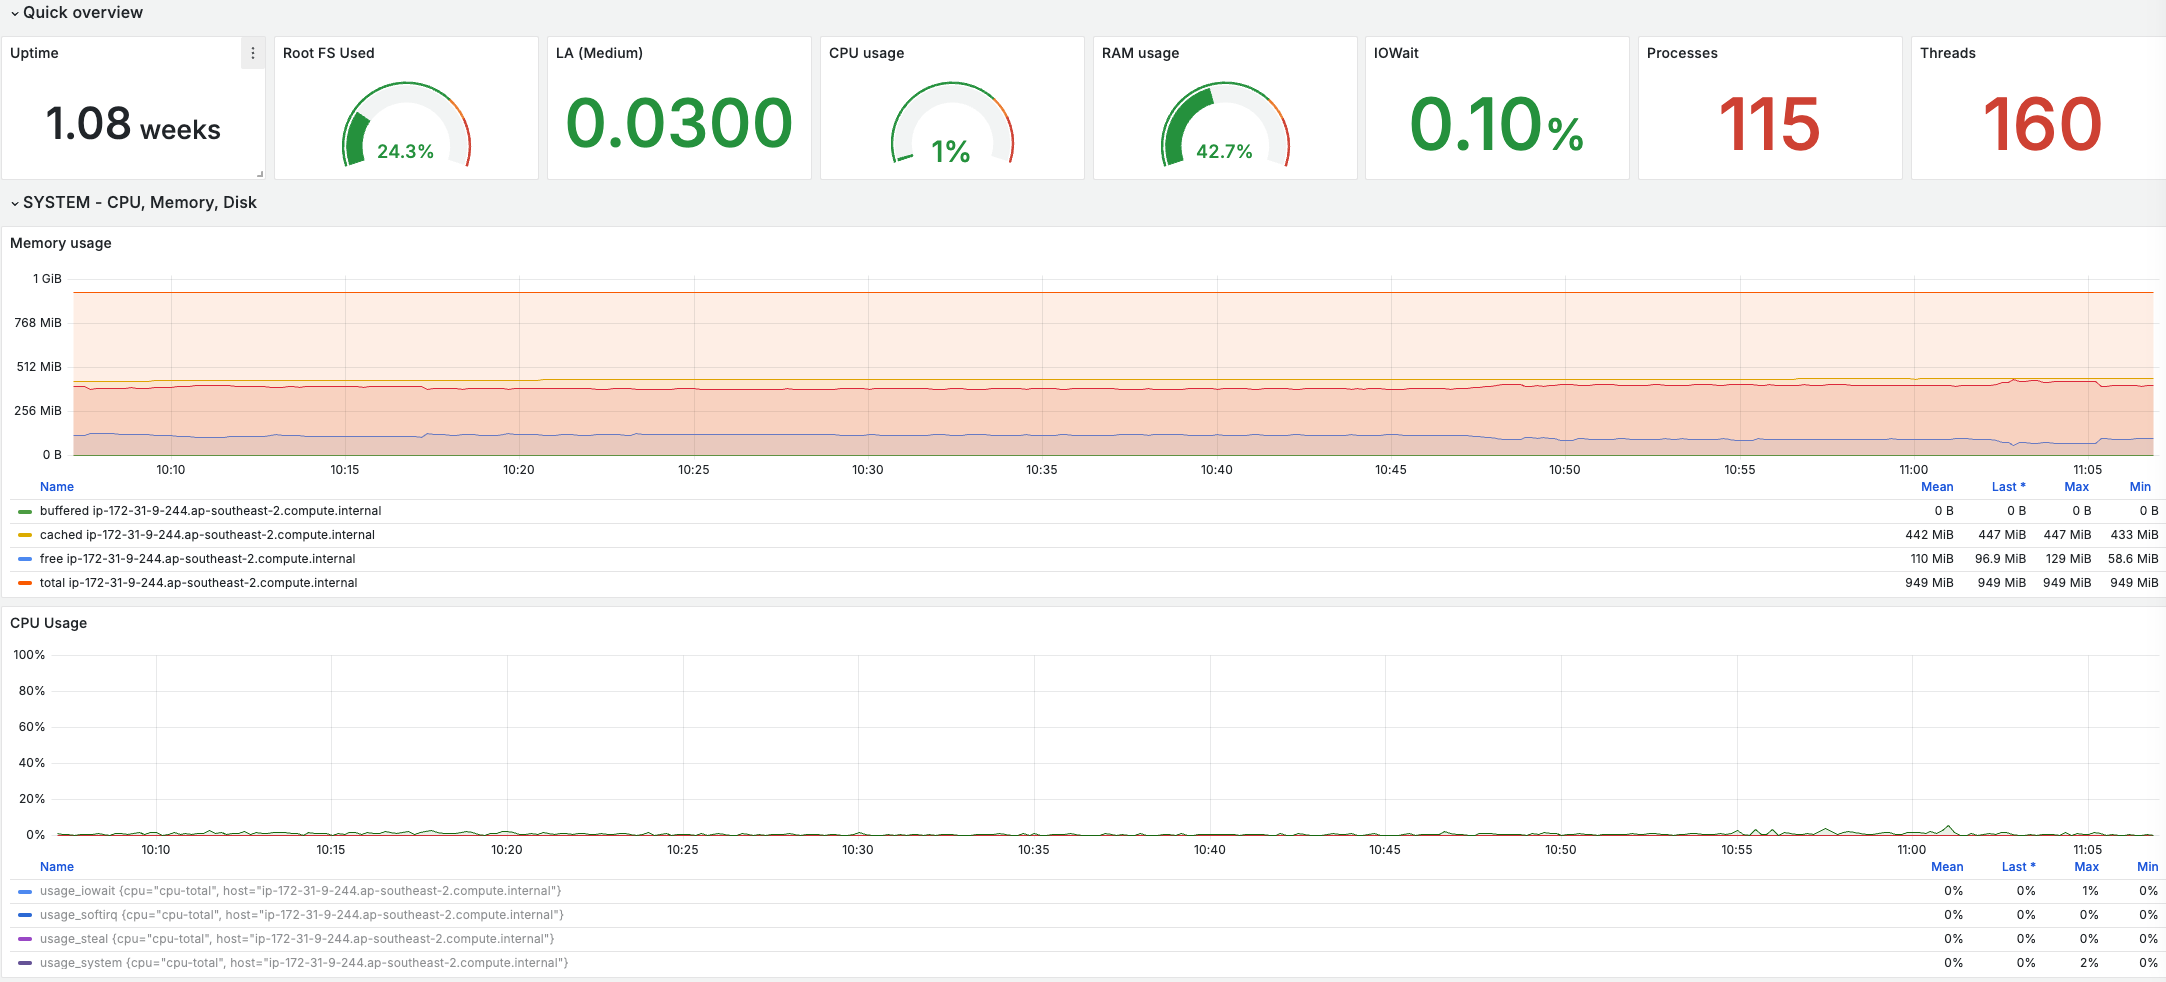
- Server uptime
- Server memory utilization - Used, cached, free
- Cpu utilization - Load average and usage
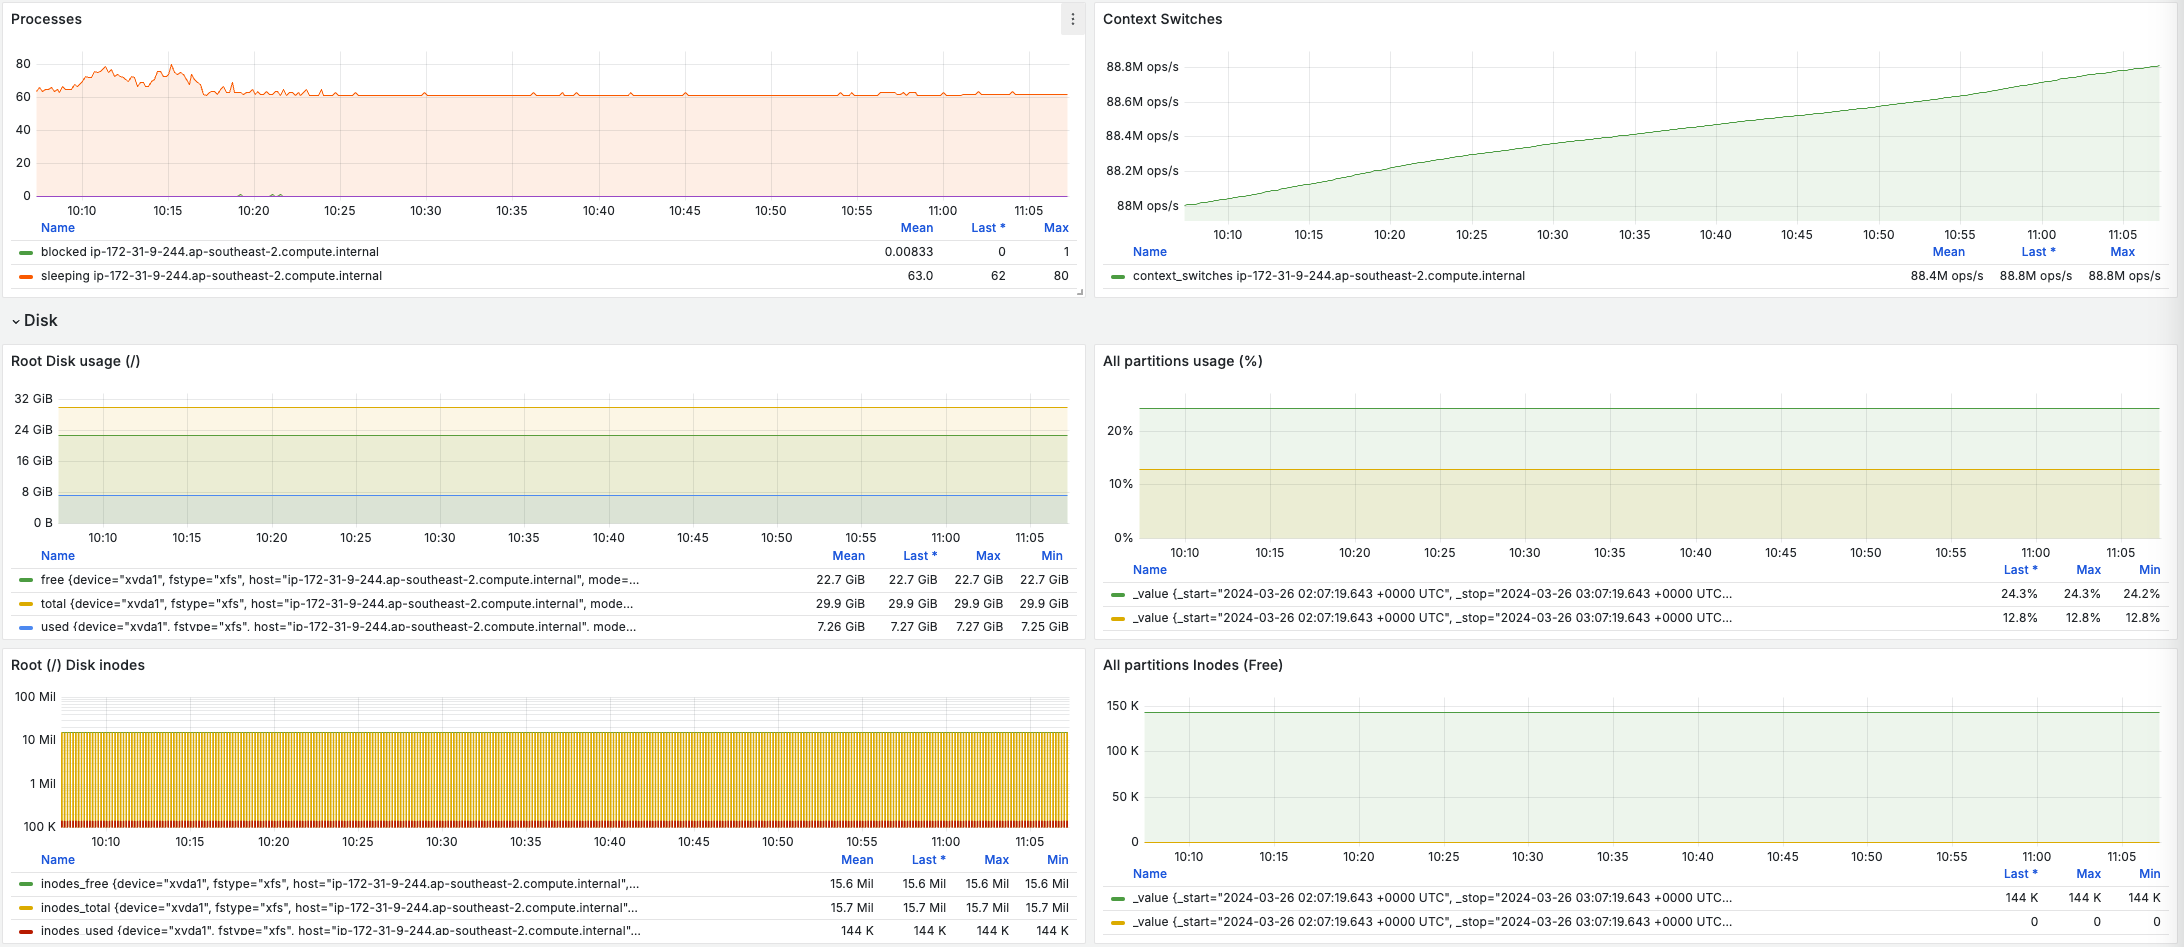
- Processes - stopped, sleeping, running e.t.c
- Disk Utilization - Free and used space for / and all othe system partitions
- Disk Inodes - / and all othe partitions in the system
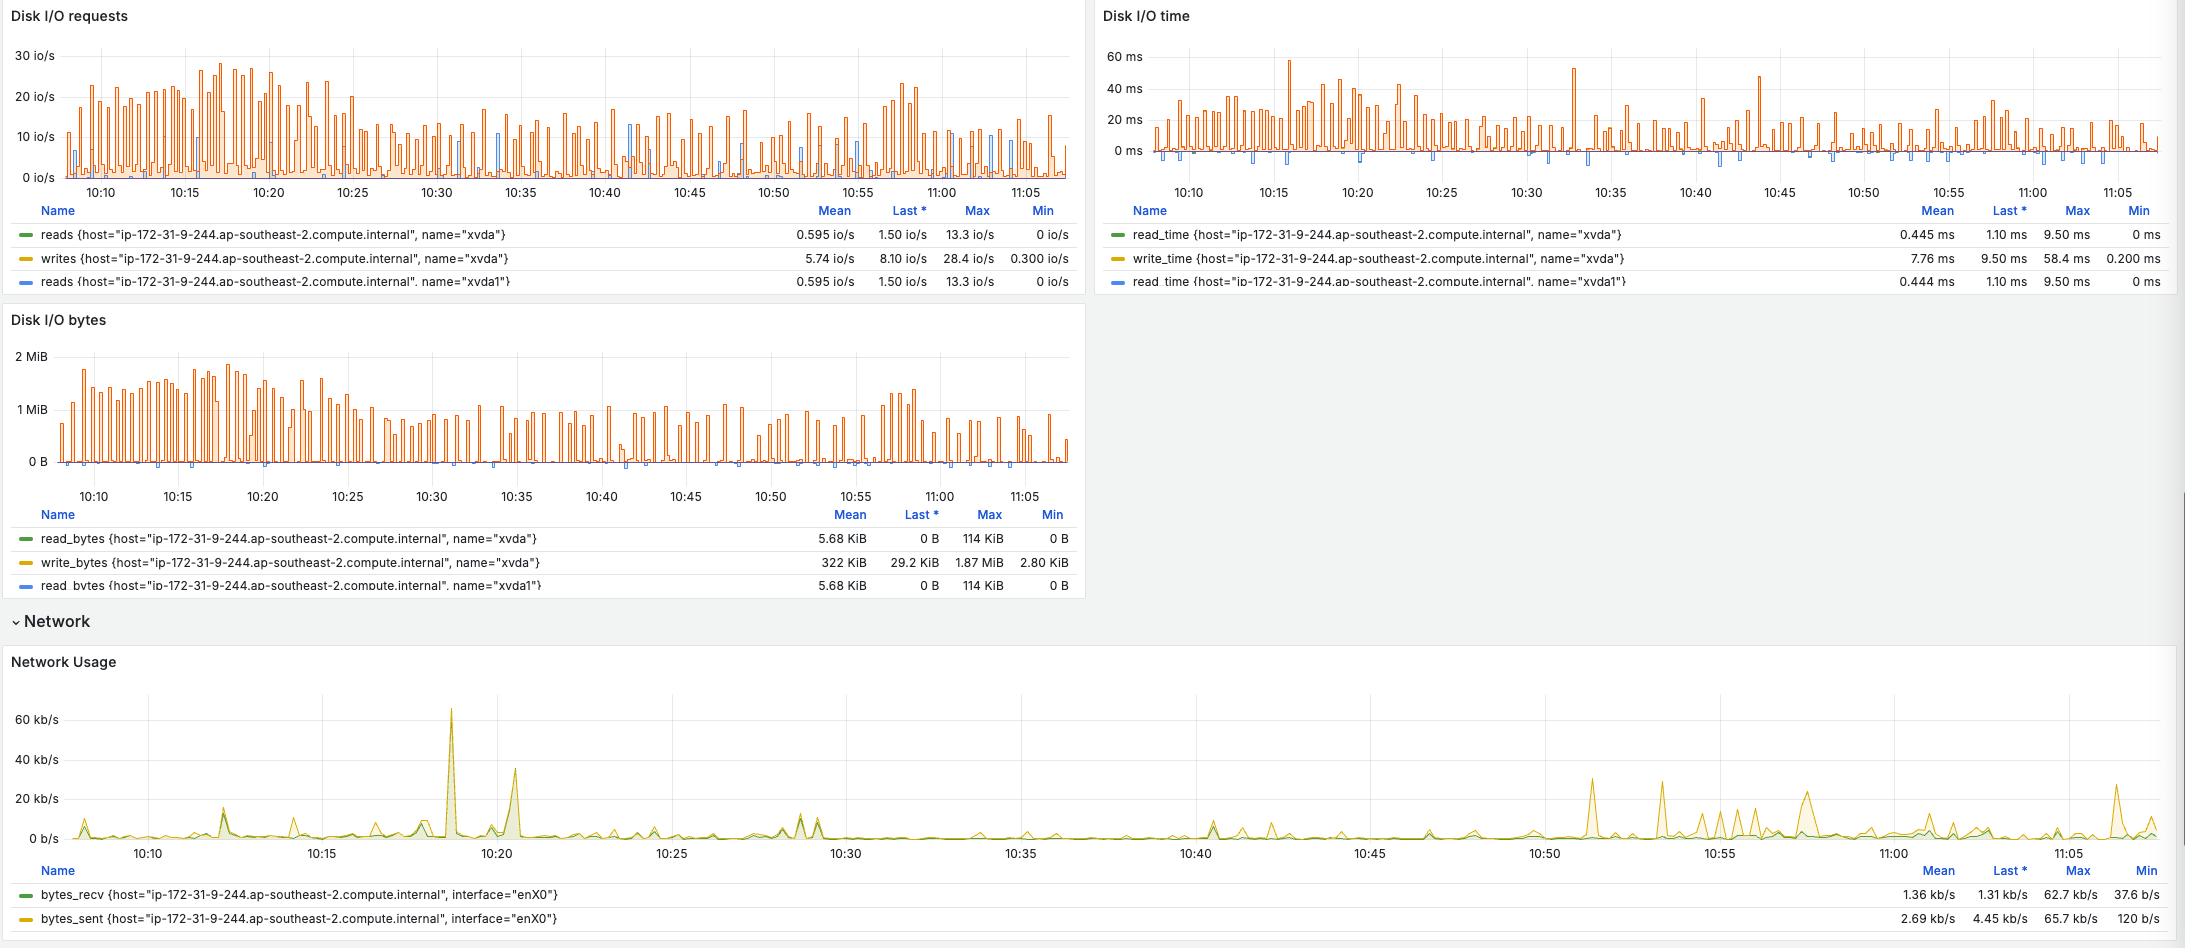
- Disk IO - requests, bytes and time
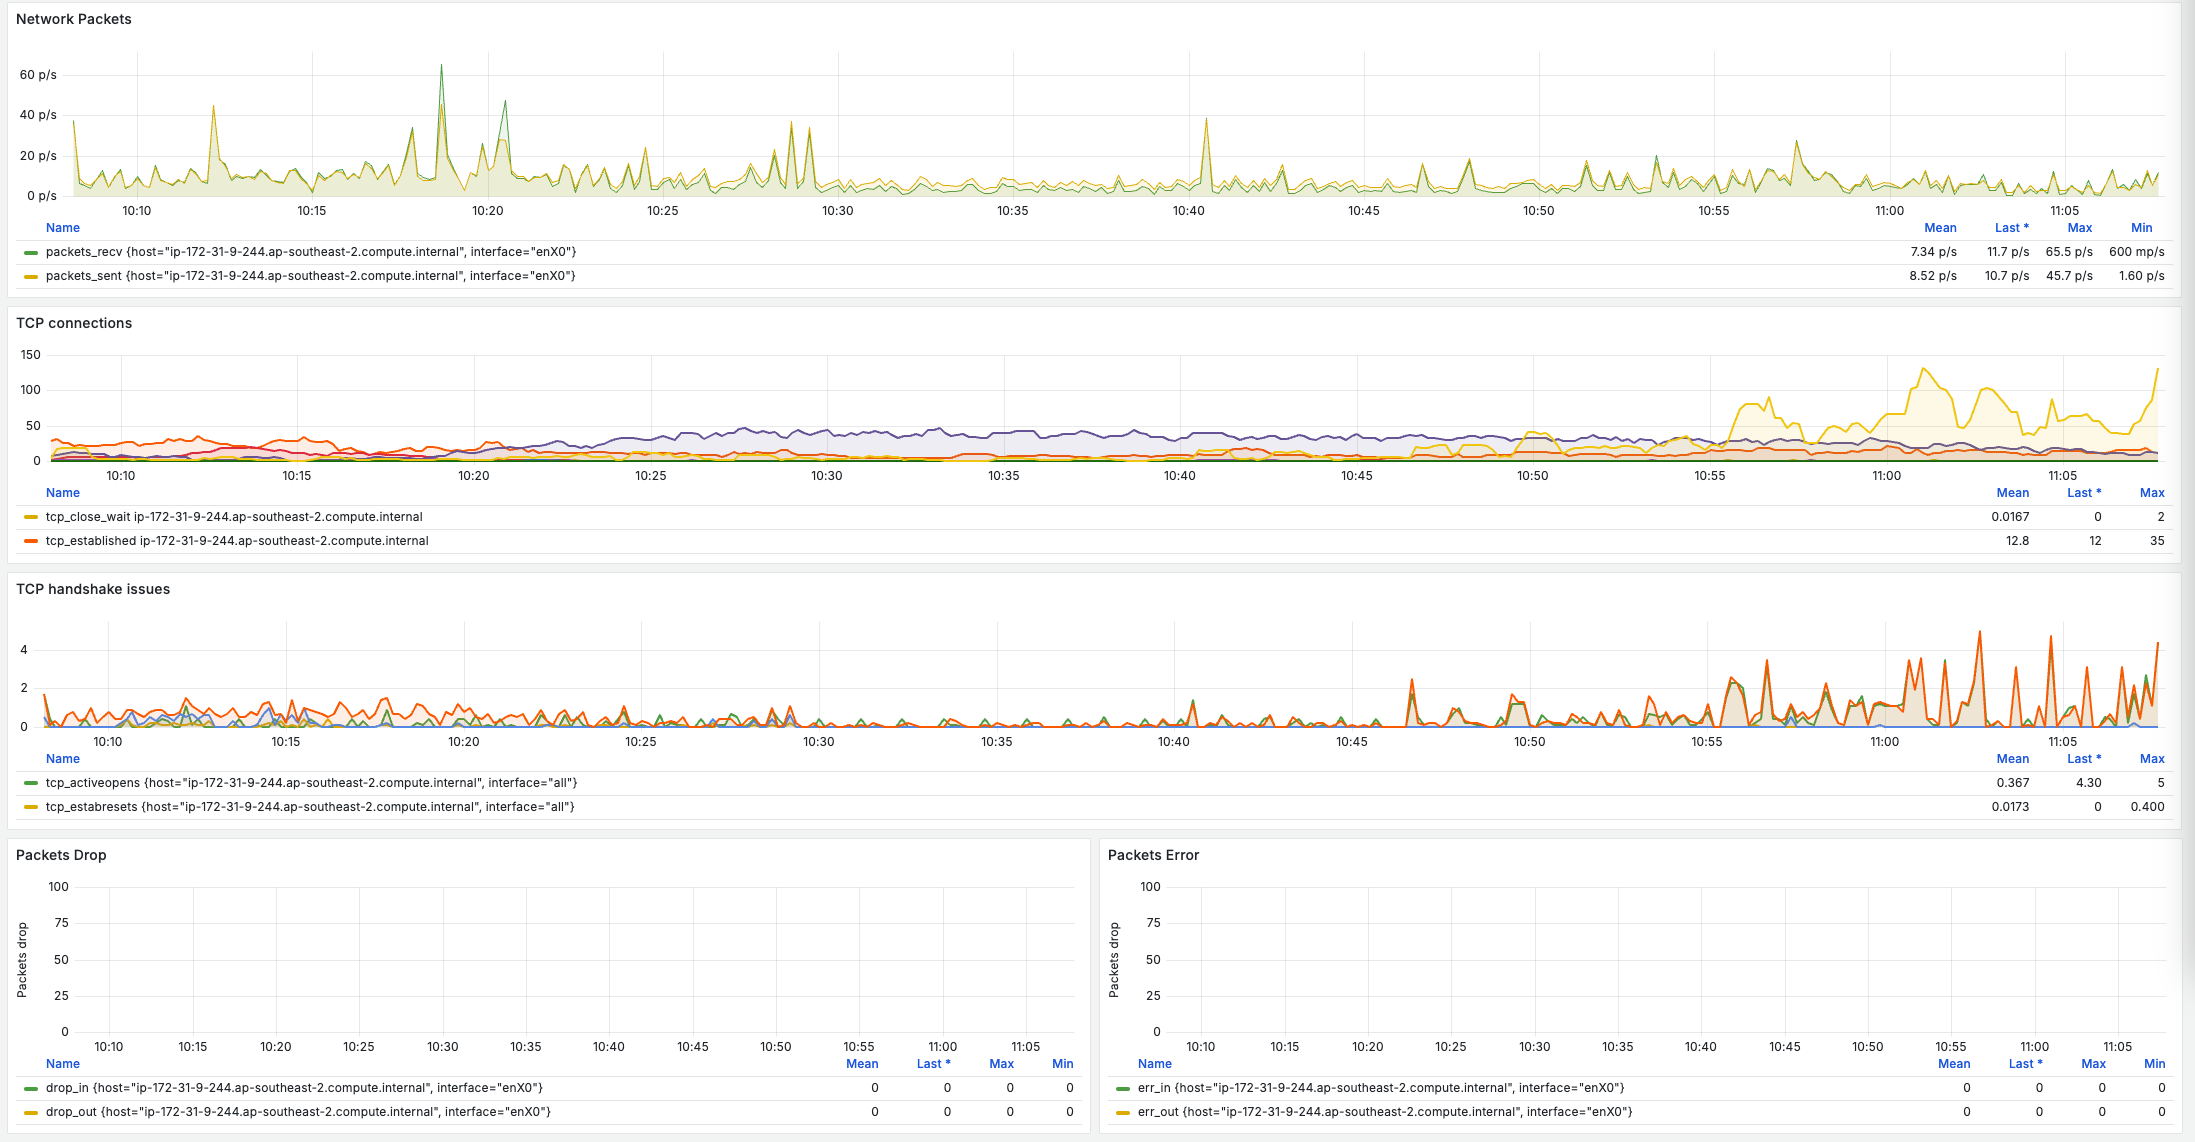
- Network stats
Data source config
Collector type:
Collector plugins:
Collector config:
Revisions
Upload an updated version of an exported dashboard.json file from Grafana
| Revision | Description | Created | |
|---|---|---|---|
| Download |