JVM & DB Metrics (Micrometer)
Dashboard for Micrometer and influx DB instrumented applications that are persisted in Influx DB (Java, Spring Boot)
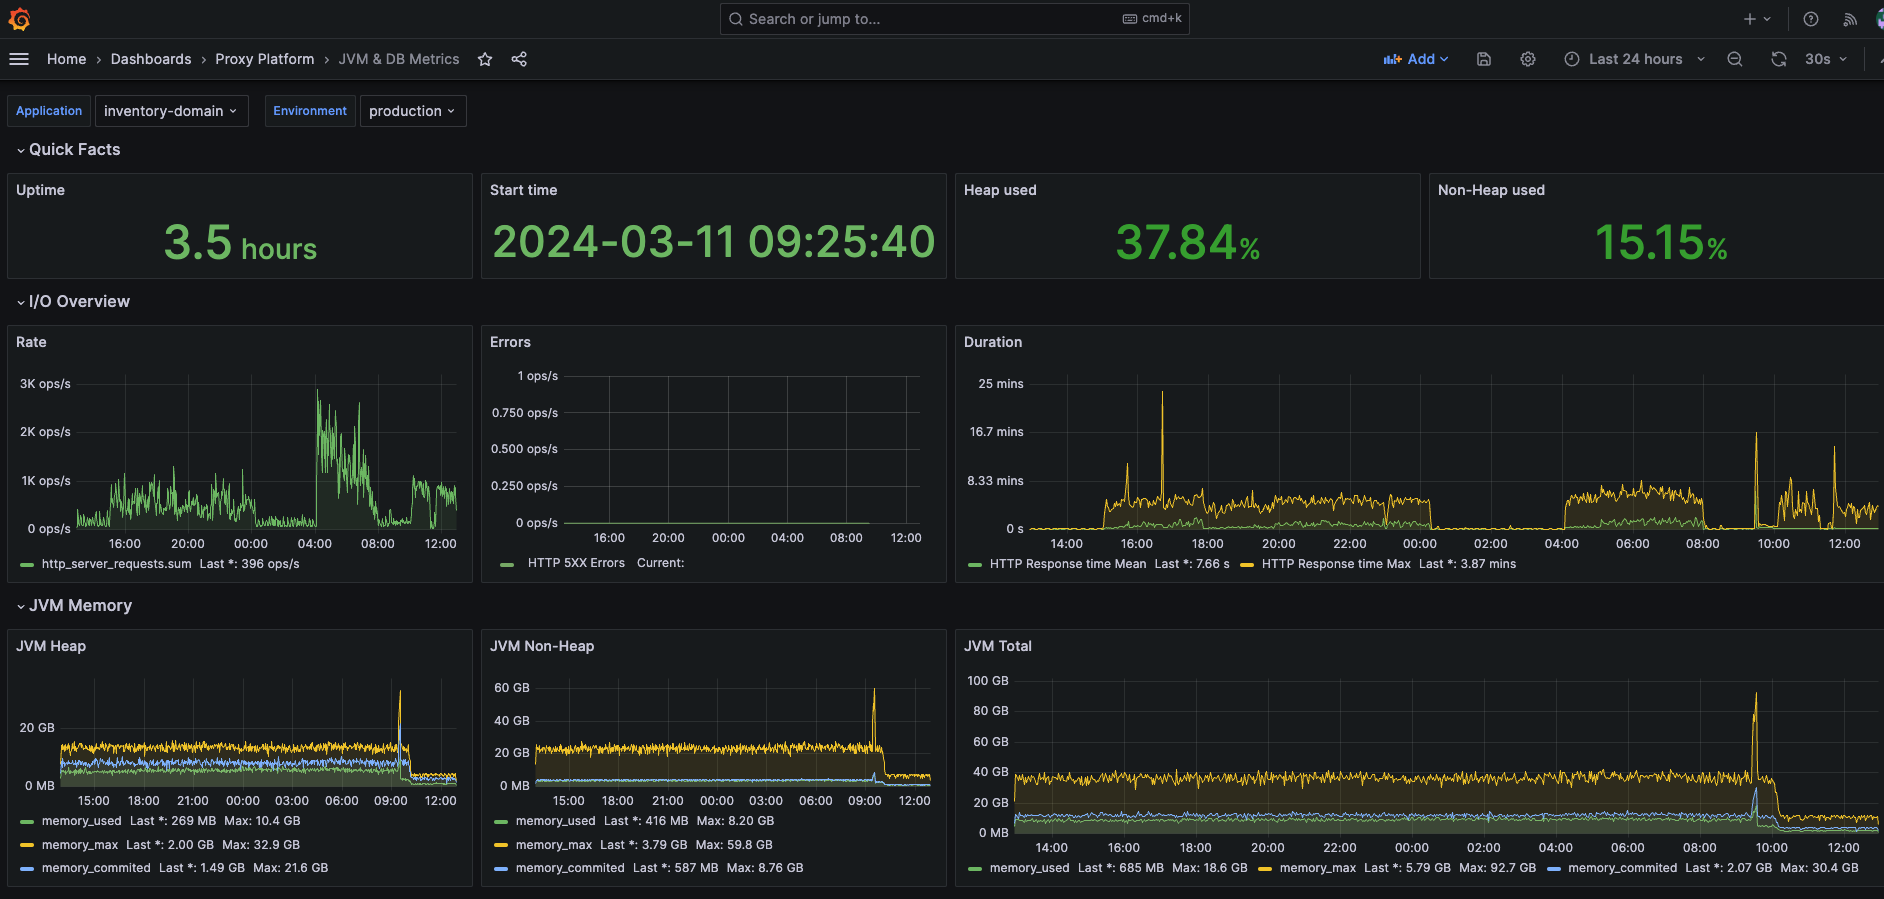
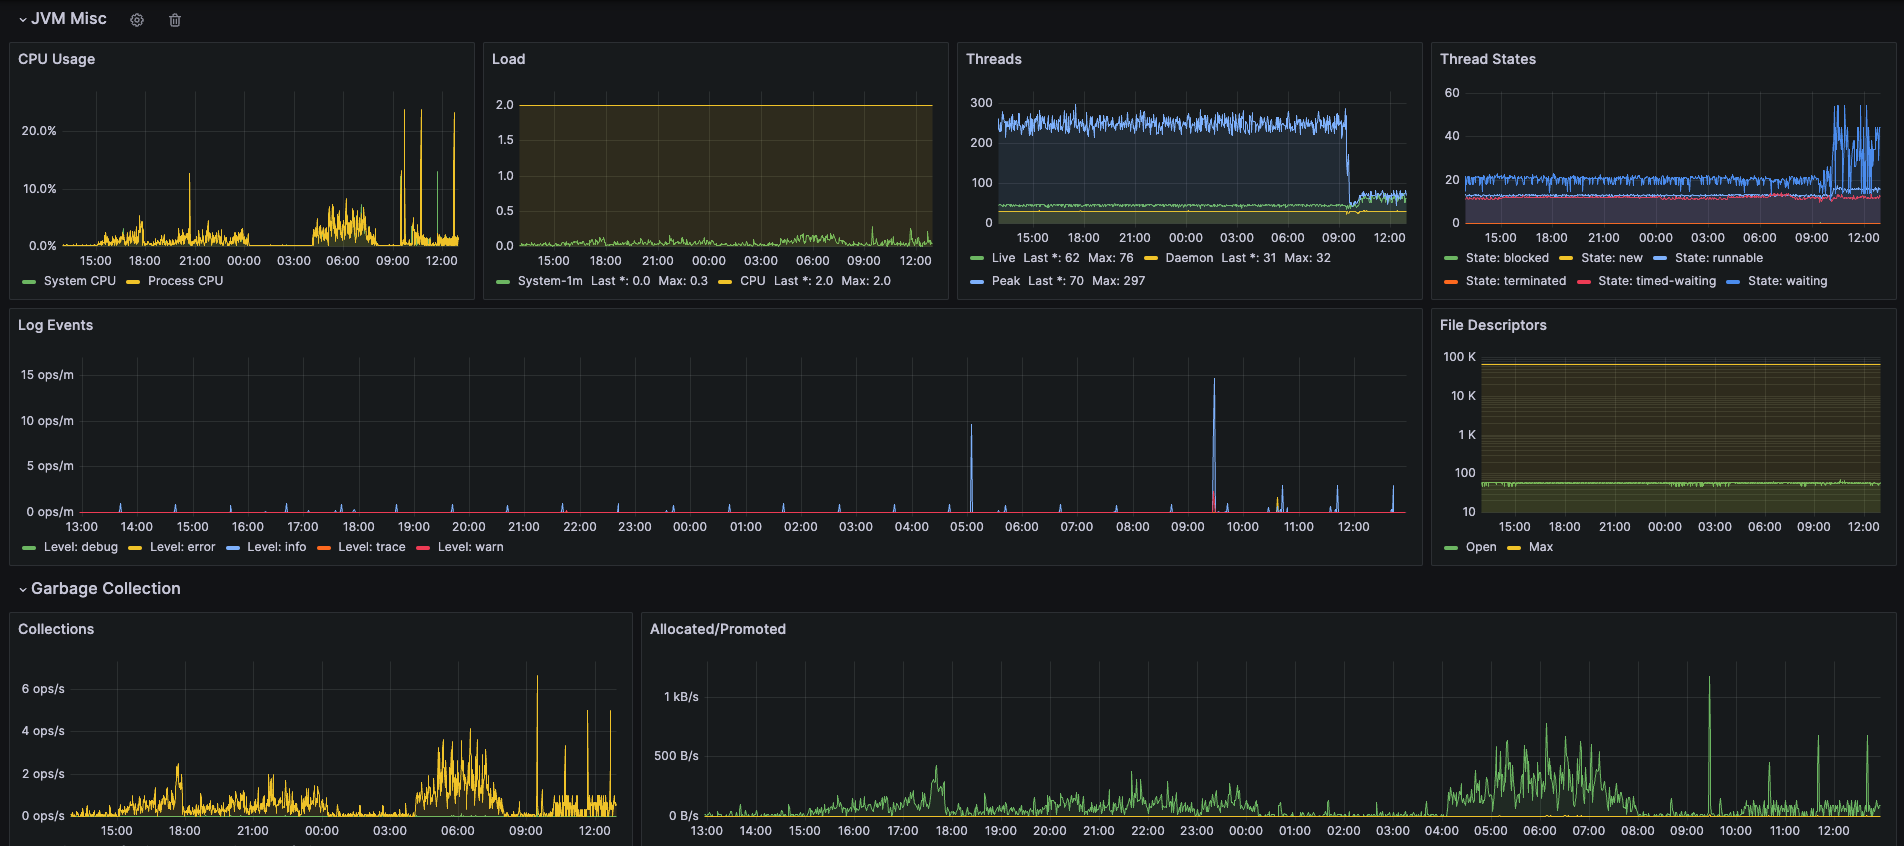
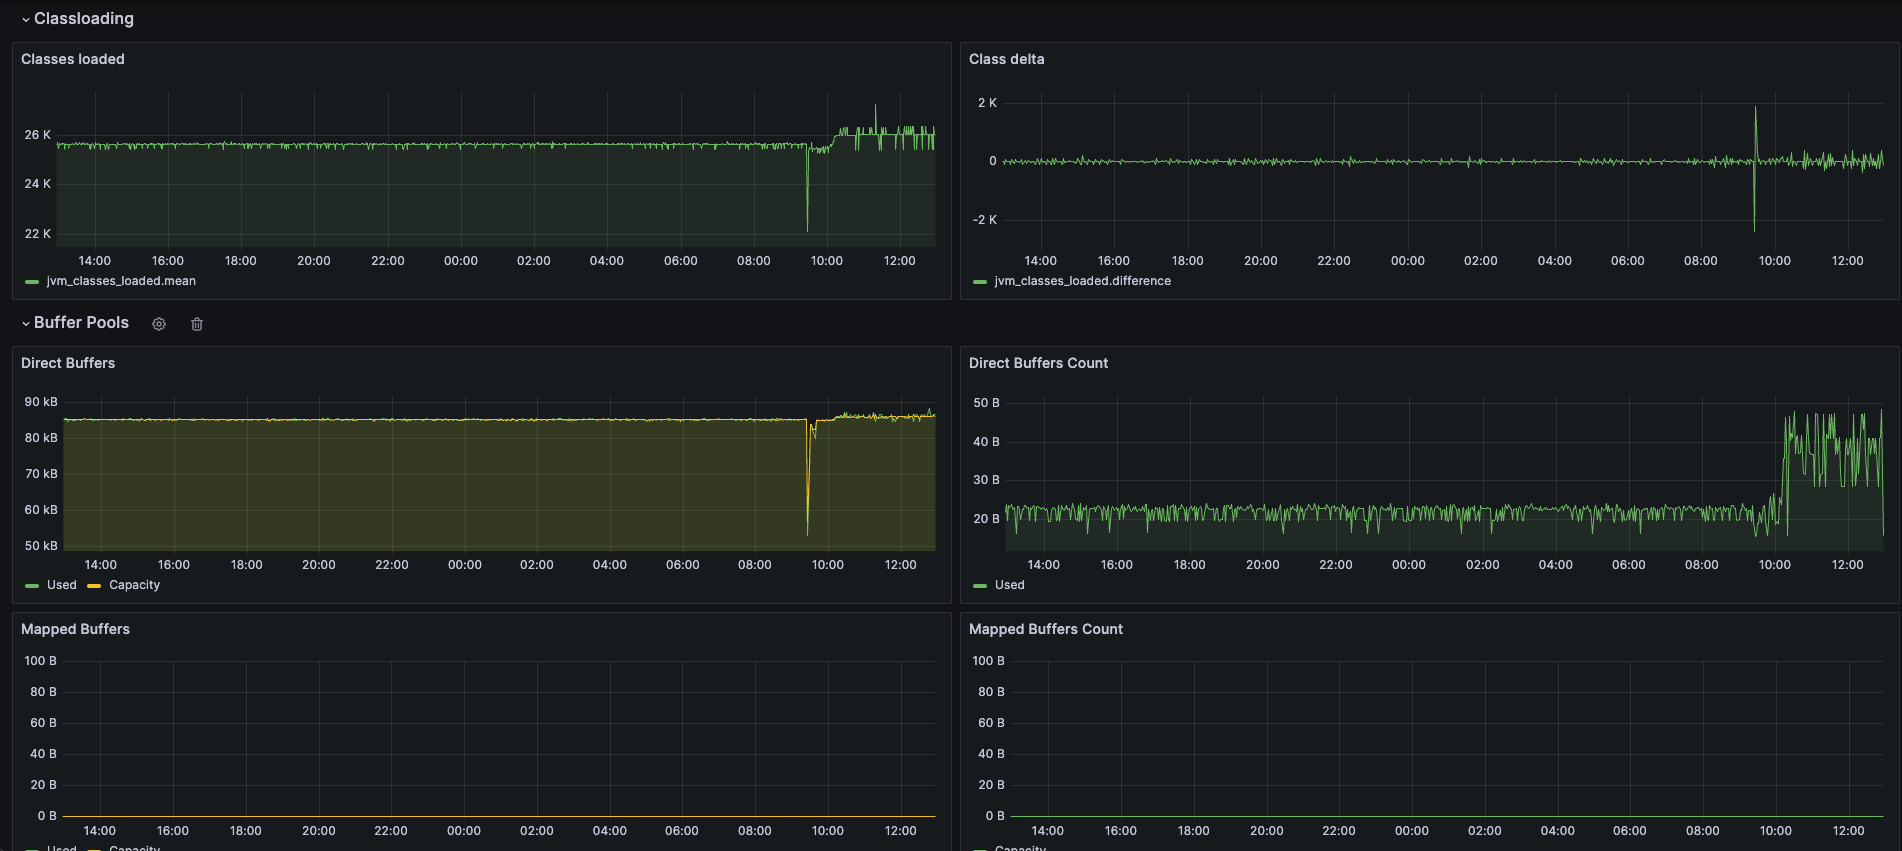
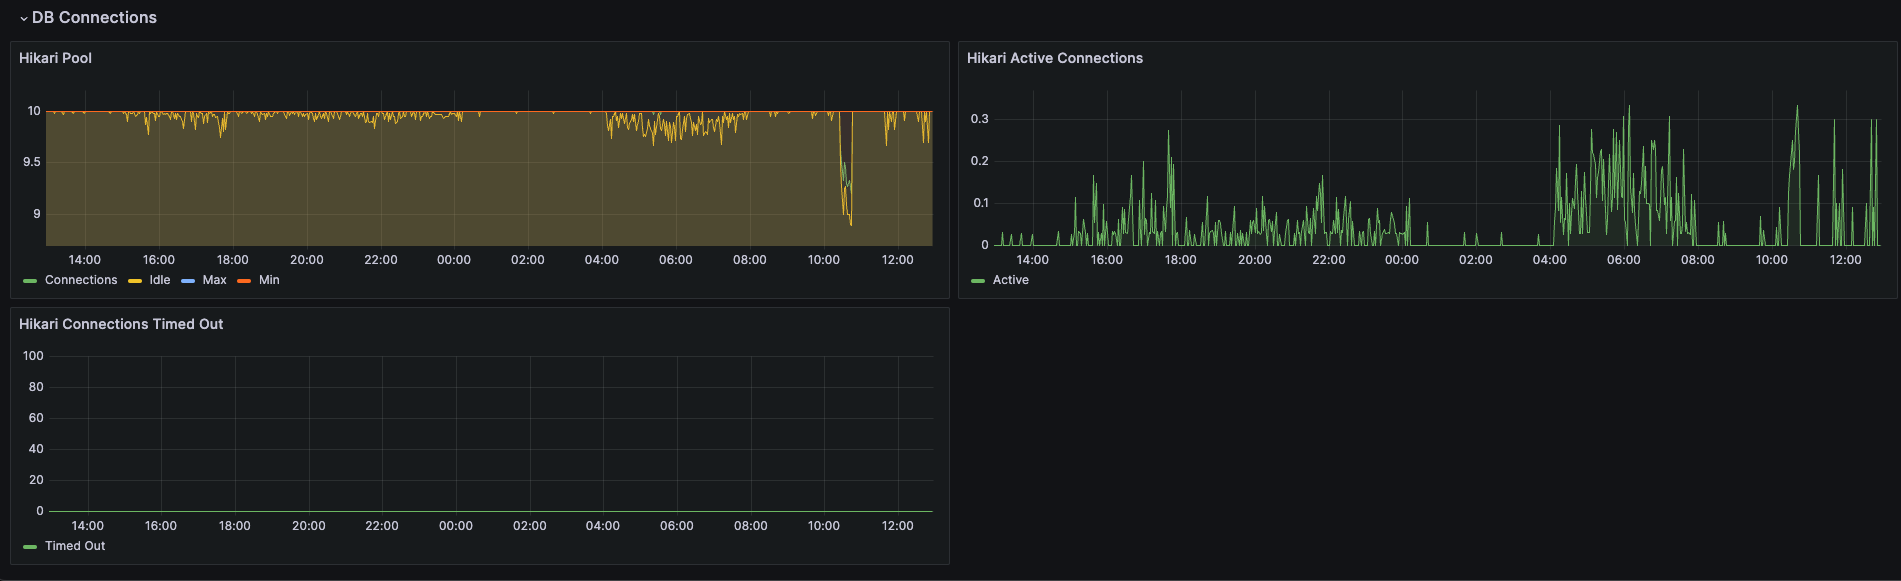
Grafana Dashboard for Micrometered Java Applications. It includes server information, JVM and Database (Hikari pool) metrics. Its variables are per application and environment by default, but they can easily be changed. Adapted with new Time Series chart and not using the old Graph ones.
Data source config
Collector type:
Collector plugins:
Collector config:
Revisions
Upload an updated version of an exported dashboard.json file from Grafana
| Revision | Description | Created | |
|---|---|---|---|
| Download |
Azure Cosmos DB
With the Grafana plugin for Azure Cosmos DB, you can quickly visualize and query your Azure Cosmos DB data from within Grafana.
Learn more