Hazelcast Map Overview
Dashboard for monitoring Hazelcast in-memory Map storage
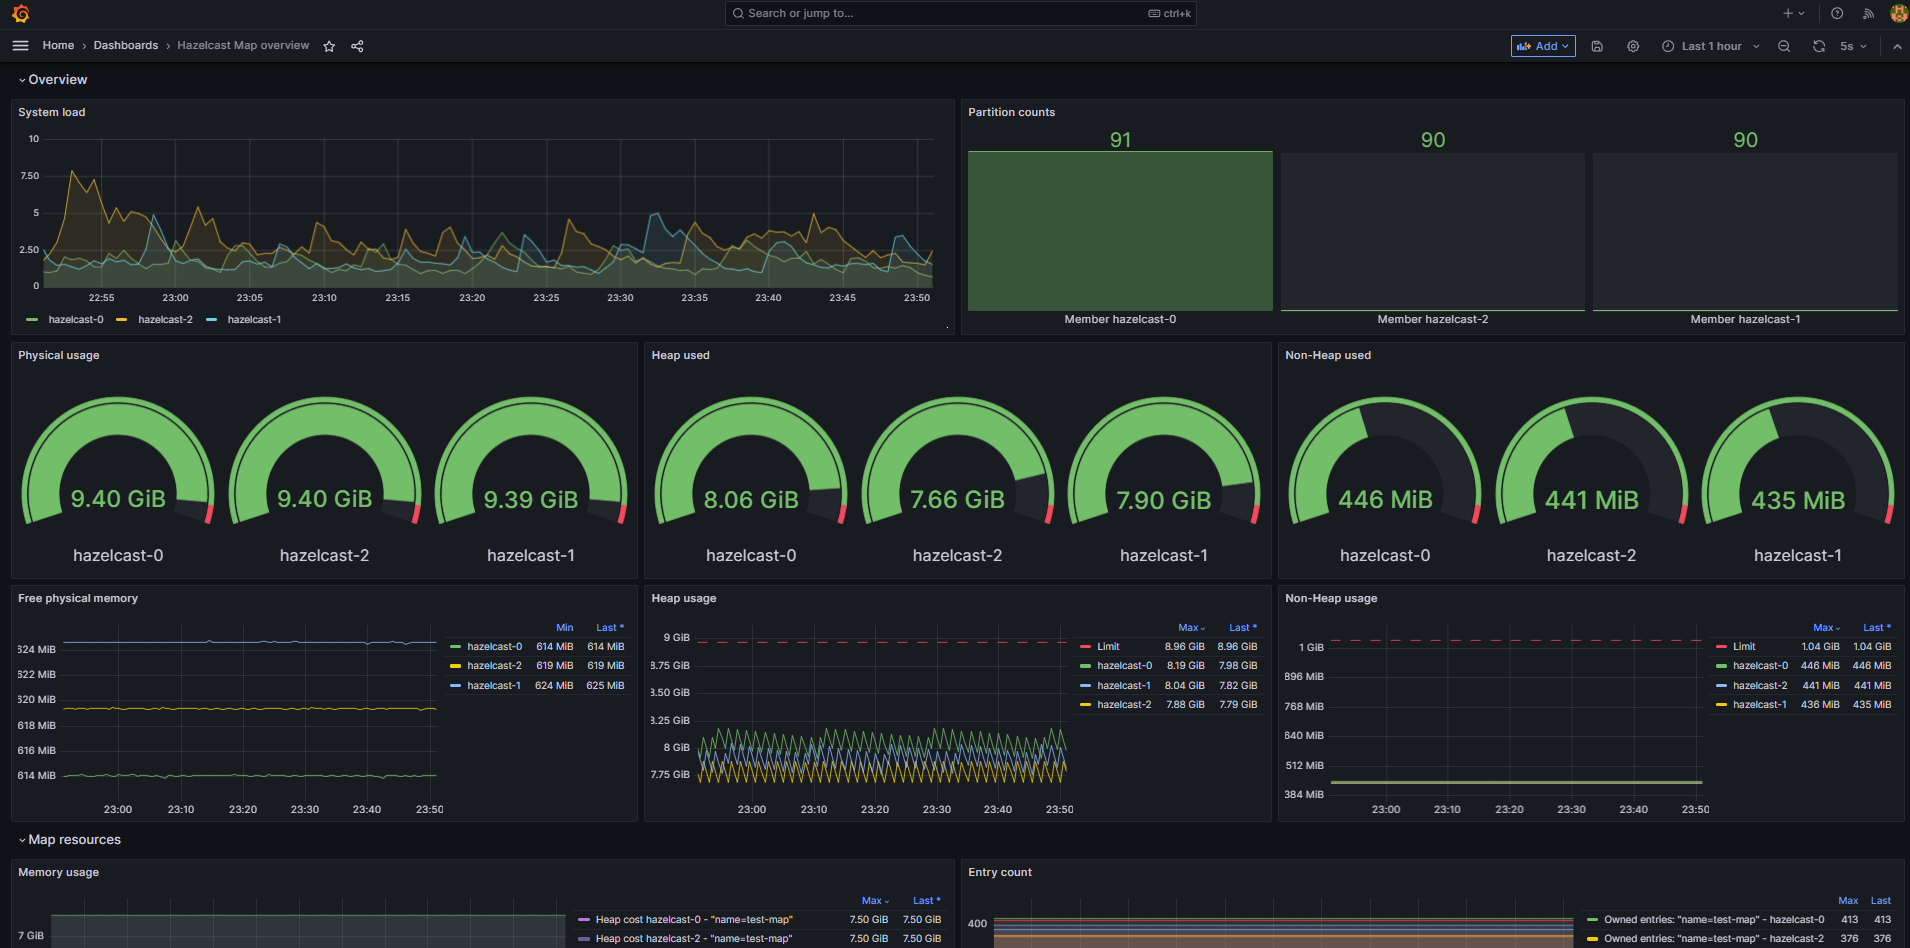
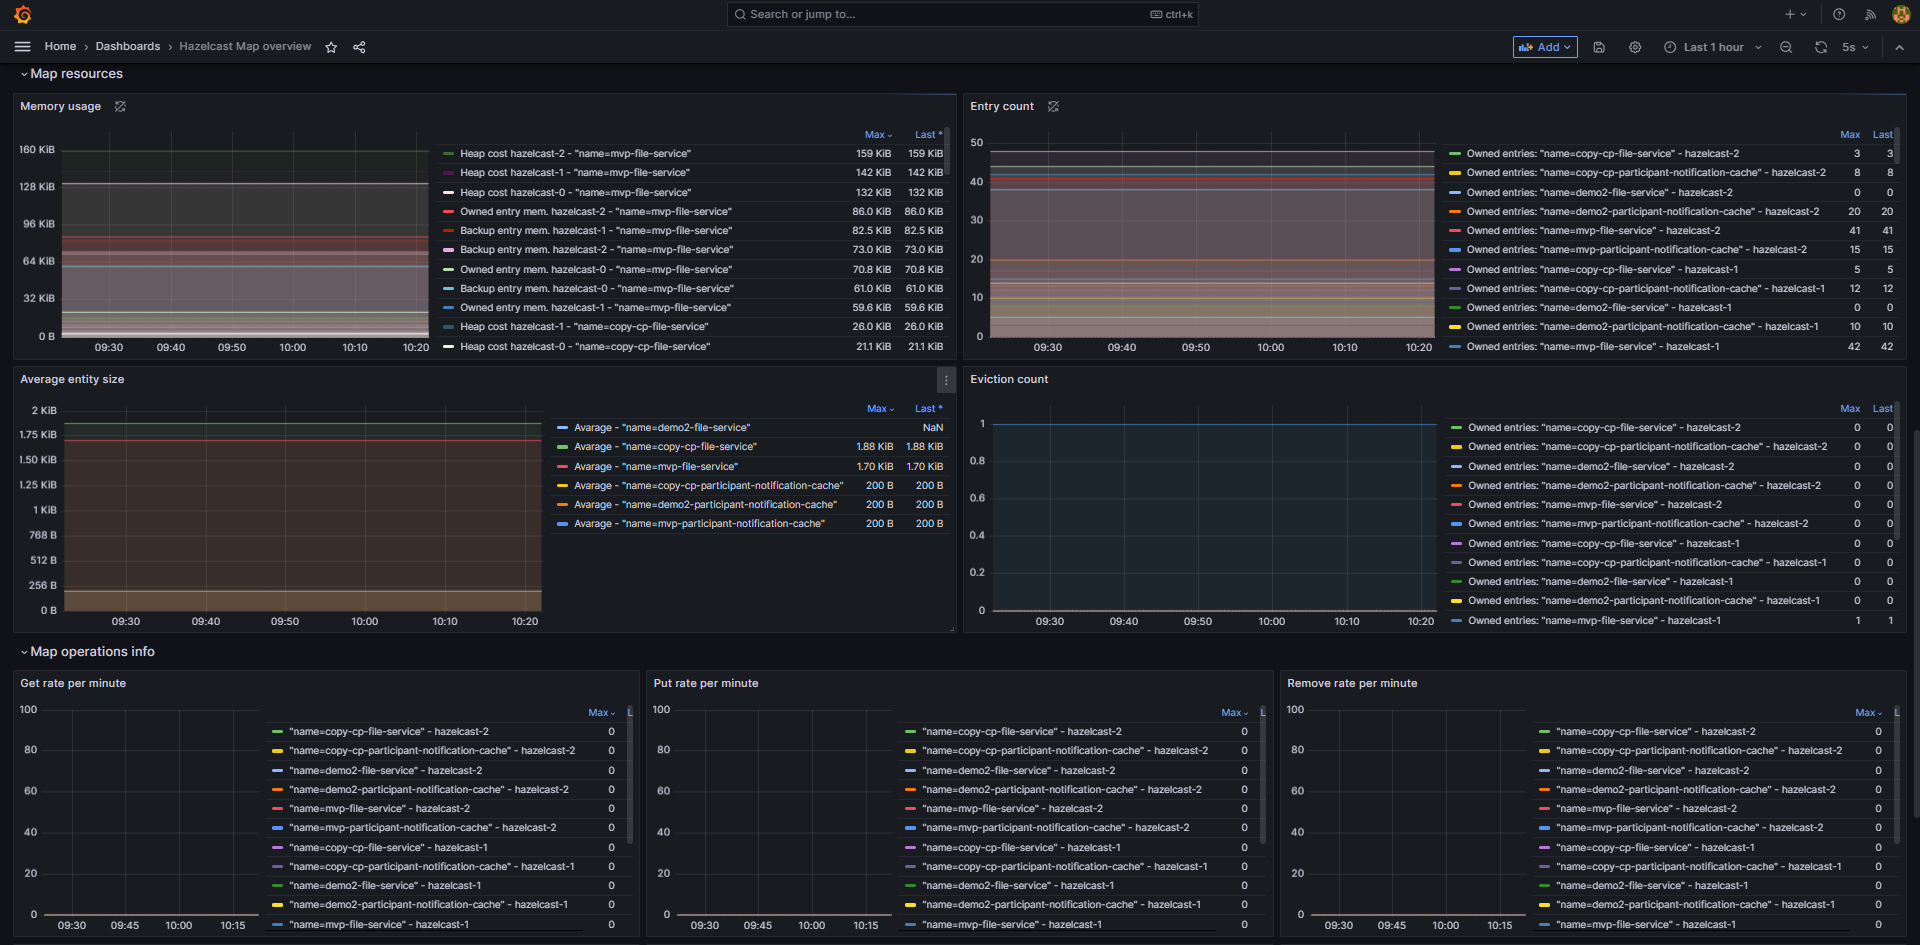
This dashboards summaries information about state of Hazelcast im-memory map storage, including resources consumption, map size, entry count etc. It uses metrics collected by prometheus jmx agent.
This dashboard based on https://grafana.com/grafana/dashboards/13183-hazelcast-default/
Data source config
Collector type:
Collector plugins:
Collector config:
Revisions
Upload an updated version of an exported dashboard.json file from Grafana
| Revision | Description | Created | |
|---|---|---|---|
| Download |