Aerospike Graph Service JVM
dashboard display key java-virtual-machine metrics like Memory, CPU, Memory, Threads, Classes, File-Descriptors and Buffers. Each group of metric is shown in individual rows
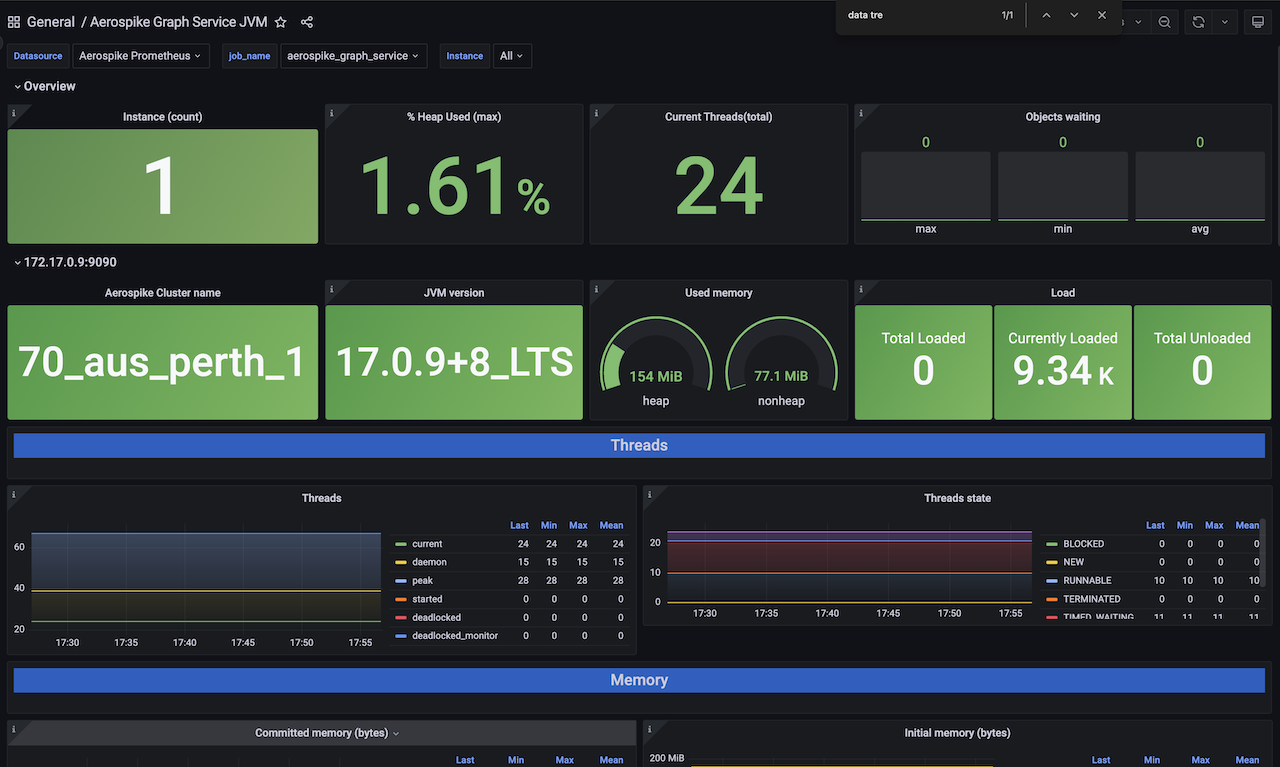
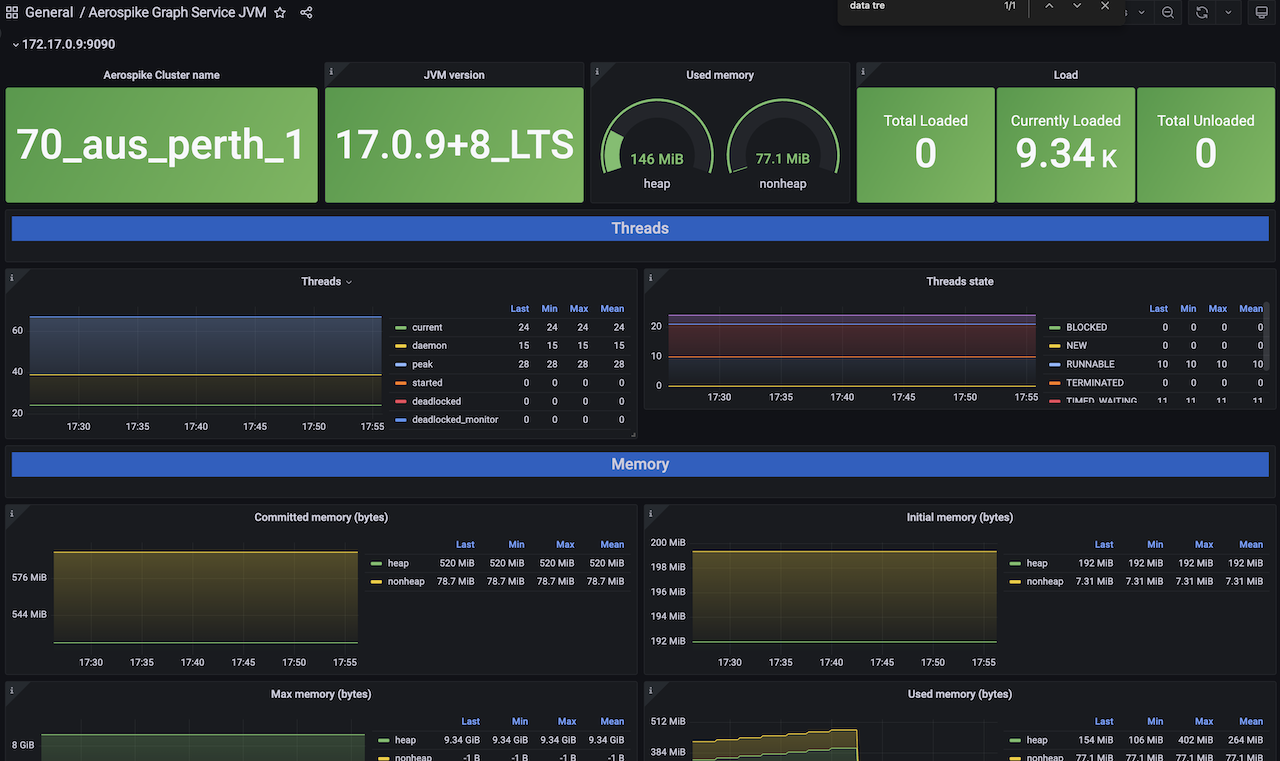
The Aerospike Graph Service JVM dashboard uses the prometheus data source to create a Grafana dashboard with the bargauge, gauge, stat, text and timeseries panels.
Data source config
Collector type:
Collector plugins:
Collector config:
Revisions
Upload an updated version of an exported dashboard.json file from Grafana
| Revision | Description | Created | |
|---|---|---|---|
| Download |
Aerospike
Easily monitor Aerospike, a multi-modal NoSQL and graph database, with Grafana Cloud's out-of-the-box monitoring solution.
Learn more