TDinsight for taosX
Monitor taosX
TDinsight for taosX - A Monitoring Solution For [taosX] with [Grafana]
TaosX is a zero-code platform for data access, synchronization, backup, and recovery of TDengine, and is an important feature of TDengine Enterprise Edition. TDinsight for taosX is a real-time display plugin used to monitor various components of taosX such as Agent, Connector, and various data source tasks. It is very simple to install and use.
Adding a TDengine Data Source
Point to the Configurations -> Data Sources menu, and click the Add data source button.

Search for and select TDengine.

Configure the TDengine datasource.

Save and test. It will report 'TDengine Data source is working' in normal circumstances.

Importing dashboard
Importing dashboard from datasource confining page.
Click Dashboard tab in TDengine datasource confining page.
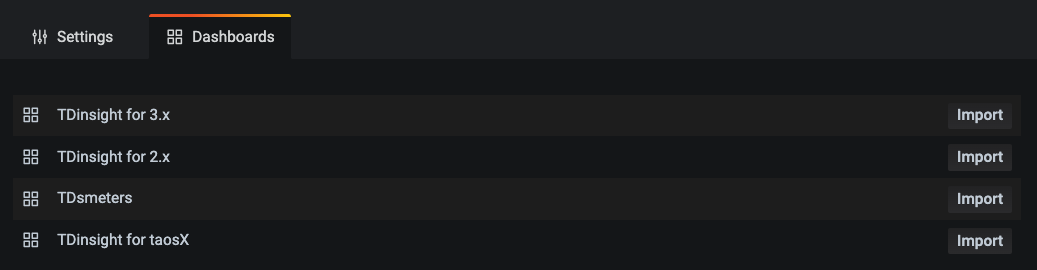
Click the "import" button of TDinsight for taoX to import the panel.
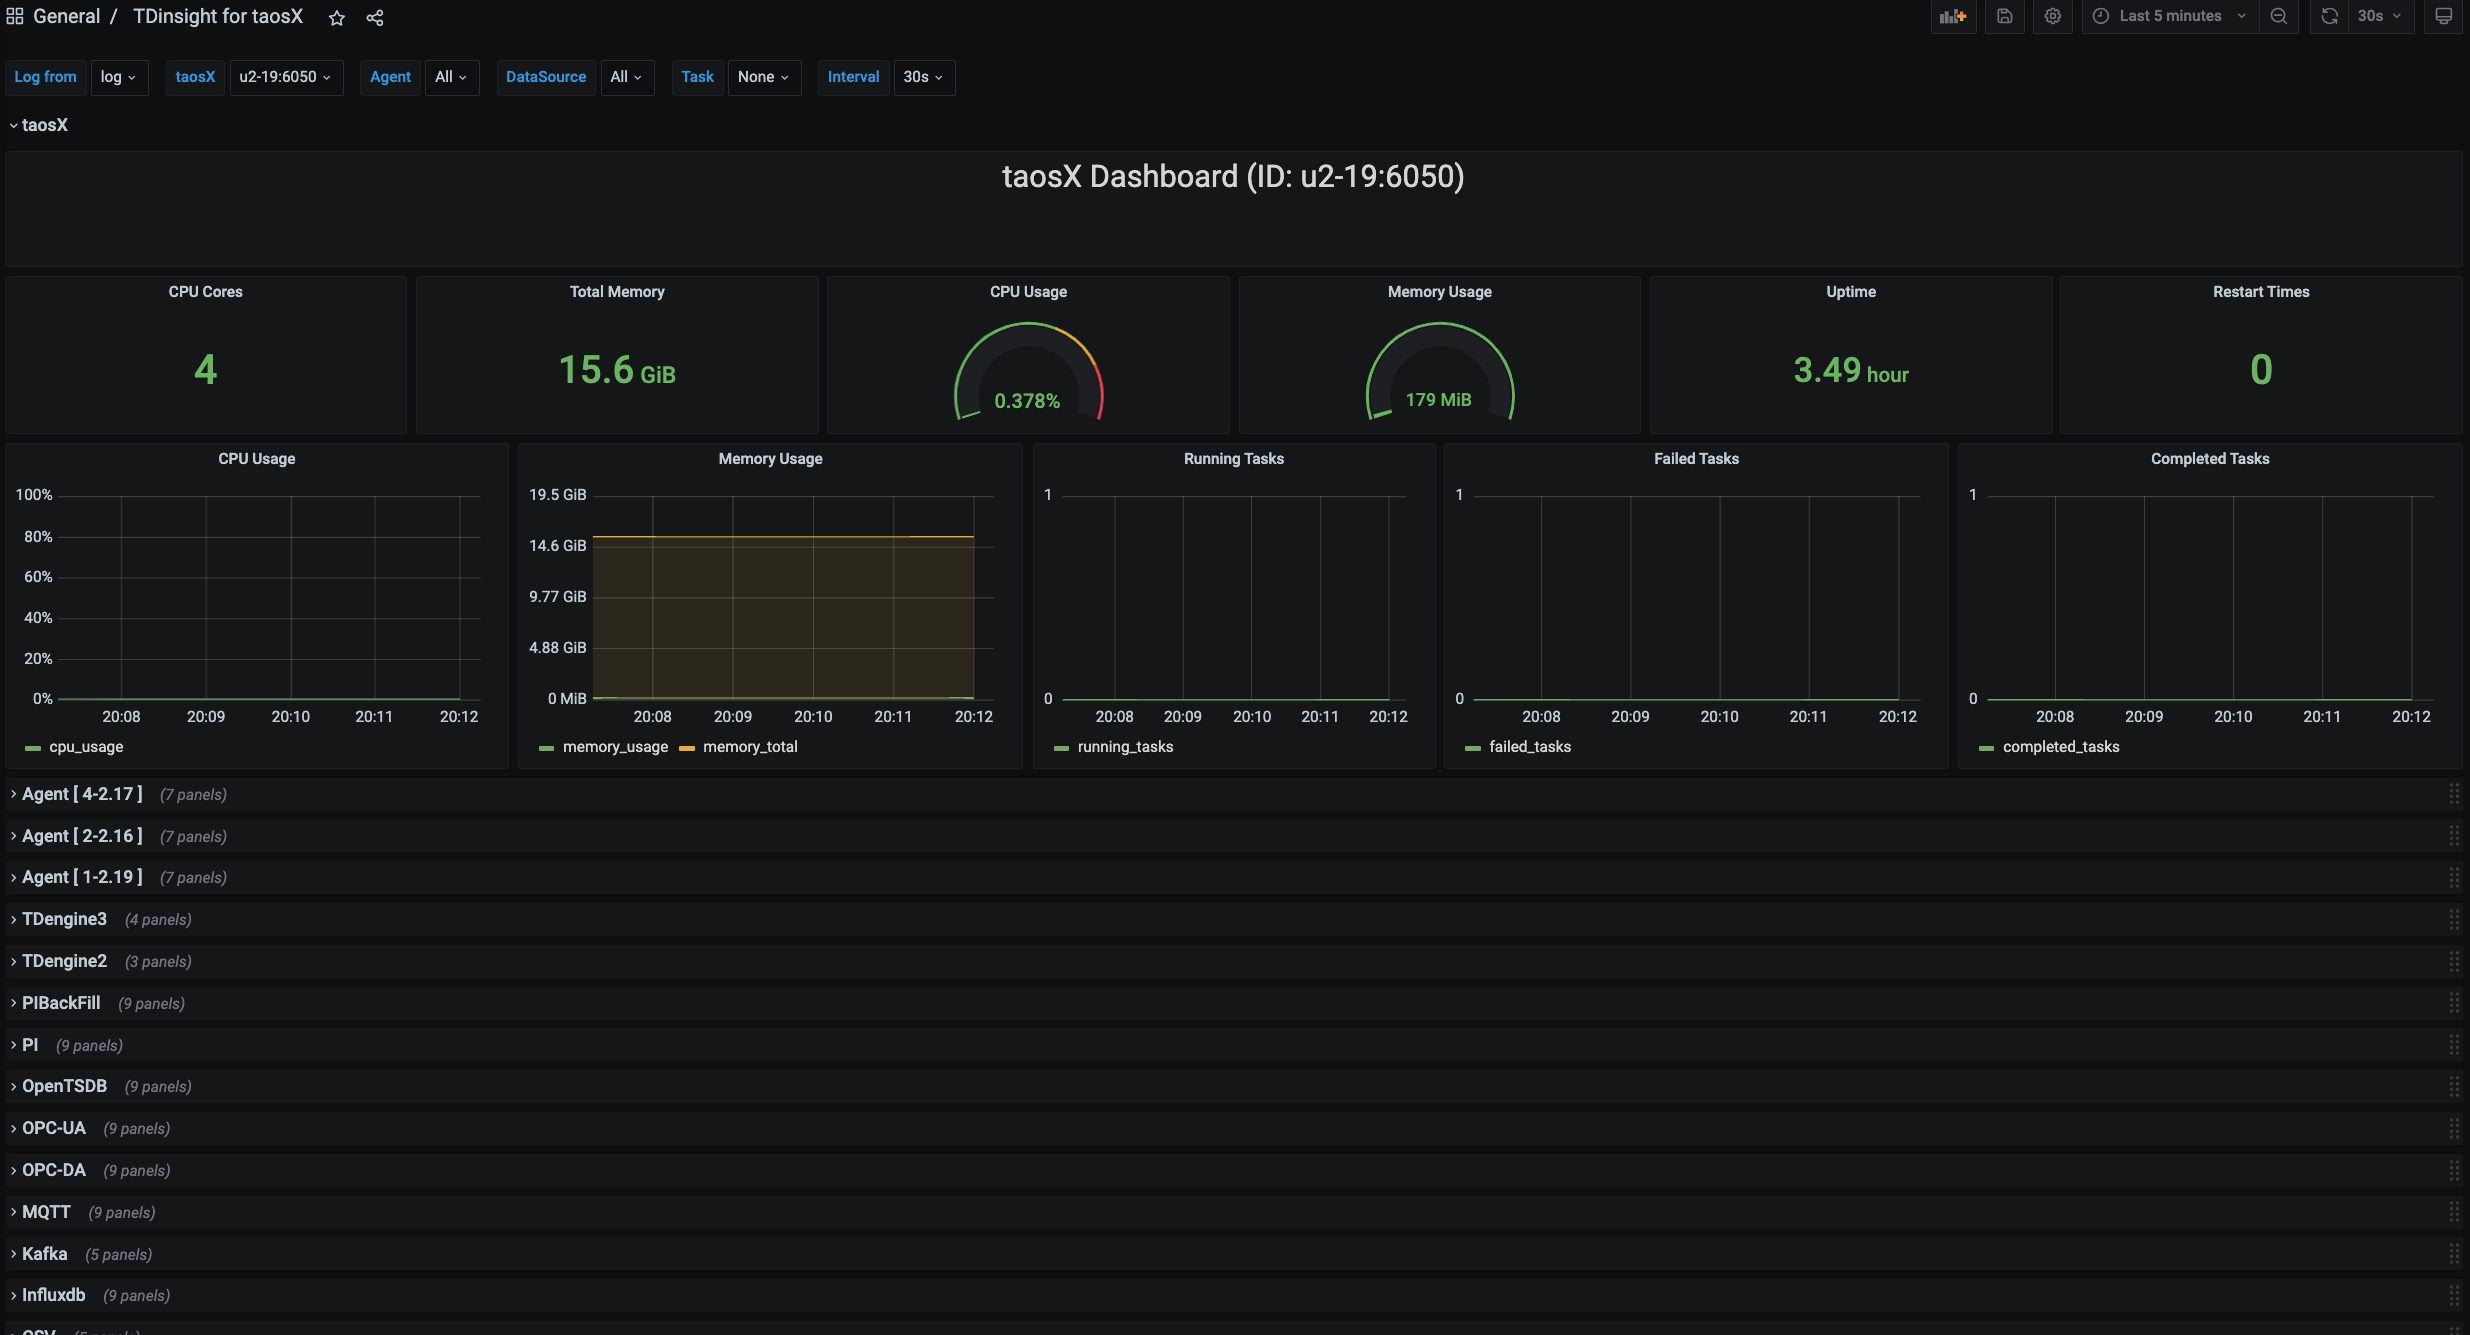
After the import is complete, the full page view of TDinsight for taoX is as shown below.

TDinsight for taosX Dashbord Detail
taosX
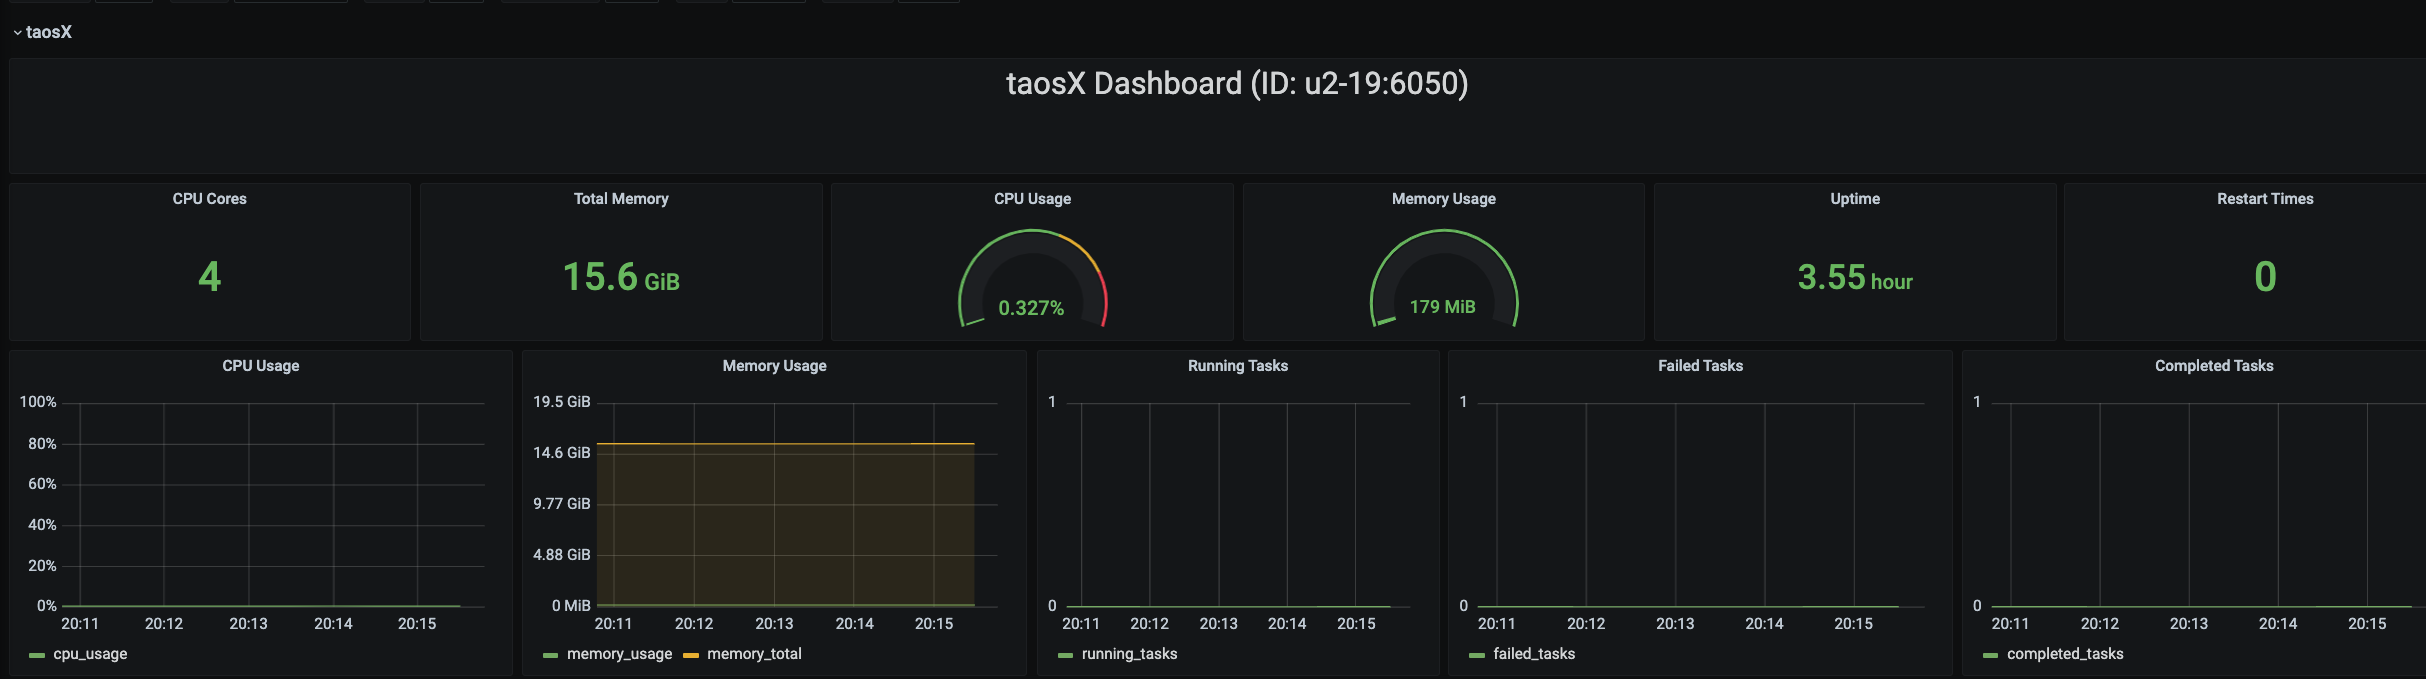
This section includes the basic information of the currently selected taosX instance (from left to right, from top to bottom).
- CPU Cores: The number of CPU cores of the machine where taosX is located.
- Total Memory: The system memory of the machine where taosX is located.
- CPU Usage: The percentage of CPU usage by the taosX process.
- Memory Usage: The percentage of memory usage by the taosX process.
- Uptime: The running time of taosX.
- Restart Times: The number of times taosX has been restarted.
- CPU Usage: The percentage of CPU usage by the taosX process, in time series form.
- Memory Usage: The percentage of memory usage by the taosX process, in time series form.
- Running Tasks: The number of tasks currently being executed.
- Failed Tasks: The number of tasks failed.
- Completed Tasks: The number of tasks completed.
Agent
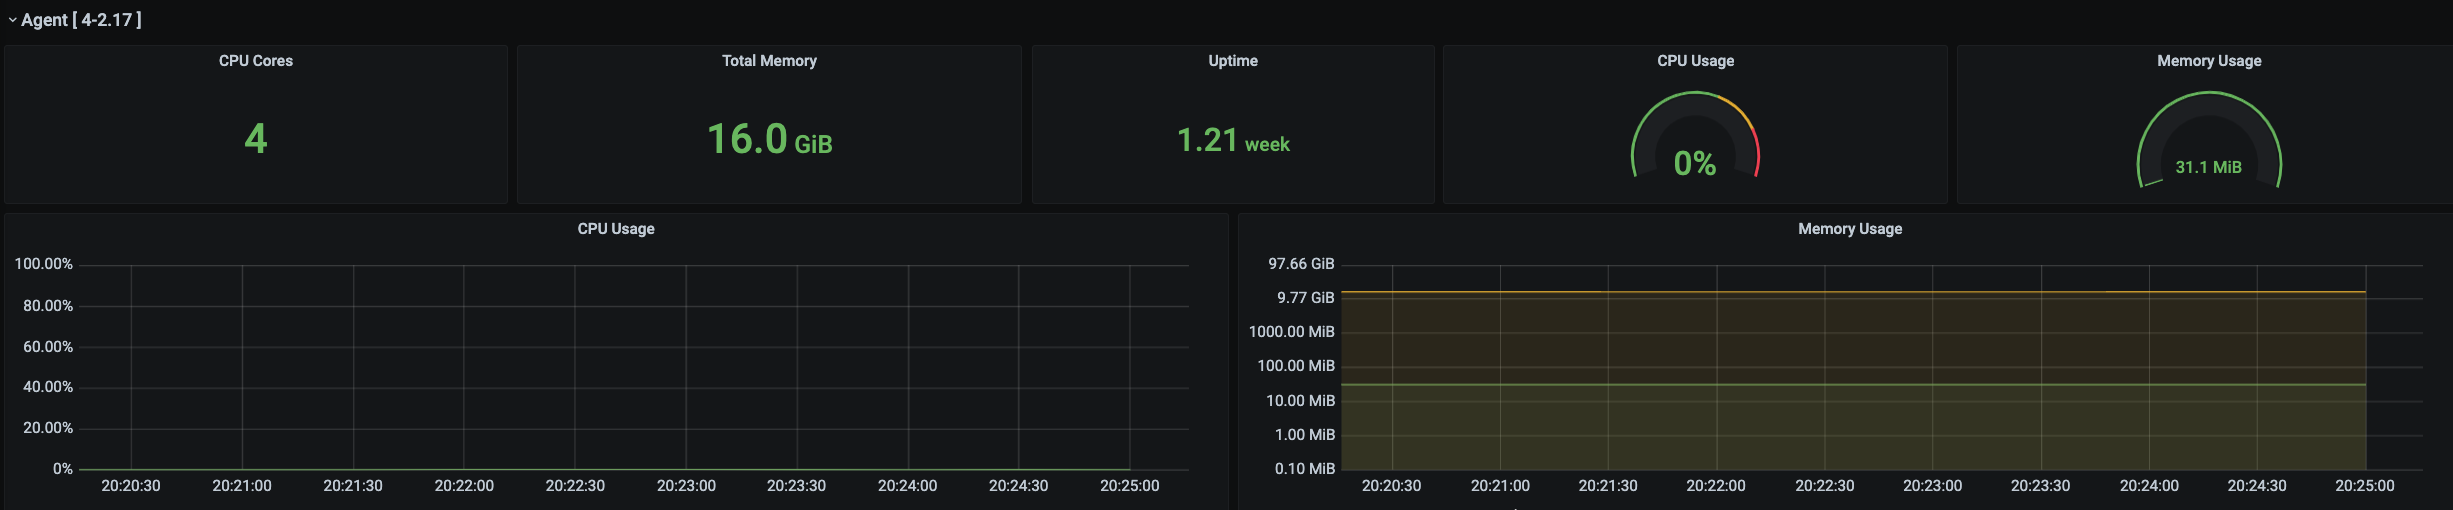
- CPU Cores: The number of CPU cores of the machine where the Agent is located.
- Total Memory: The system memory of the machine where the Agent is located.
- CPU Usage: The percentage of CPU usage by the Agent process.
- Memory Usage: The percentage of memory usage by the Agent process.
- CPU Usage: The percentage of CPU usage by the Agent process, in time series form.
- Memory Usage: The percentage of memory usage by the Agent process, in time series form.
TDengine3
- Task Info: Task information, including task id, name, execution time, number of rows written, total execution time, and total number of rows written.
- Inserted Rows Rate: Insertion rate of rows.
- Inserted Points Rate: Insertion rate of points.
- Write Raw Fails: The number of times the writing of raw meta failed.
OPC-UA
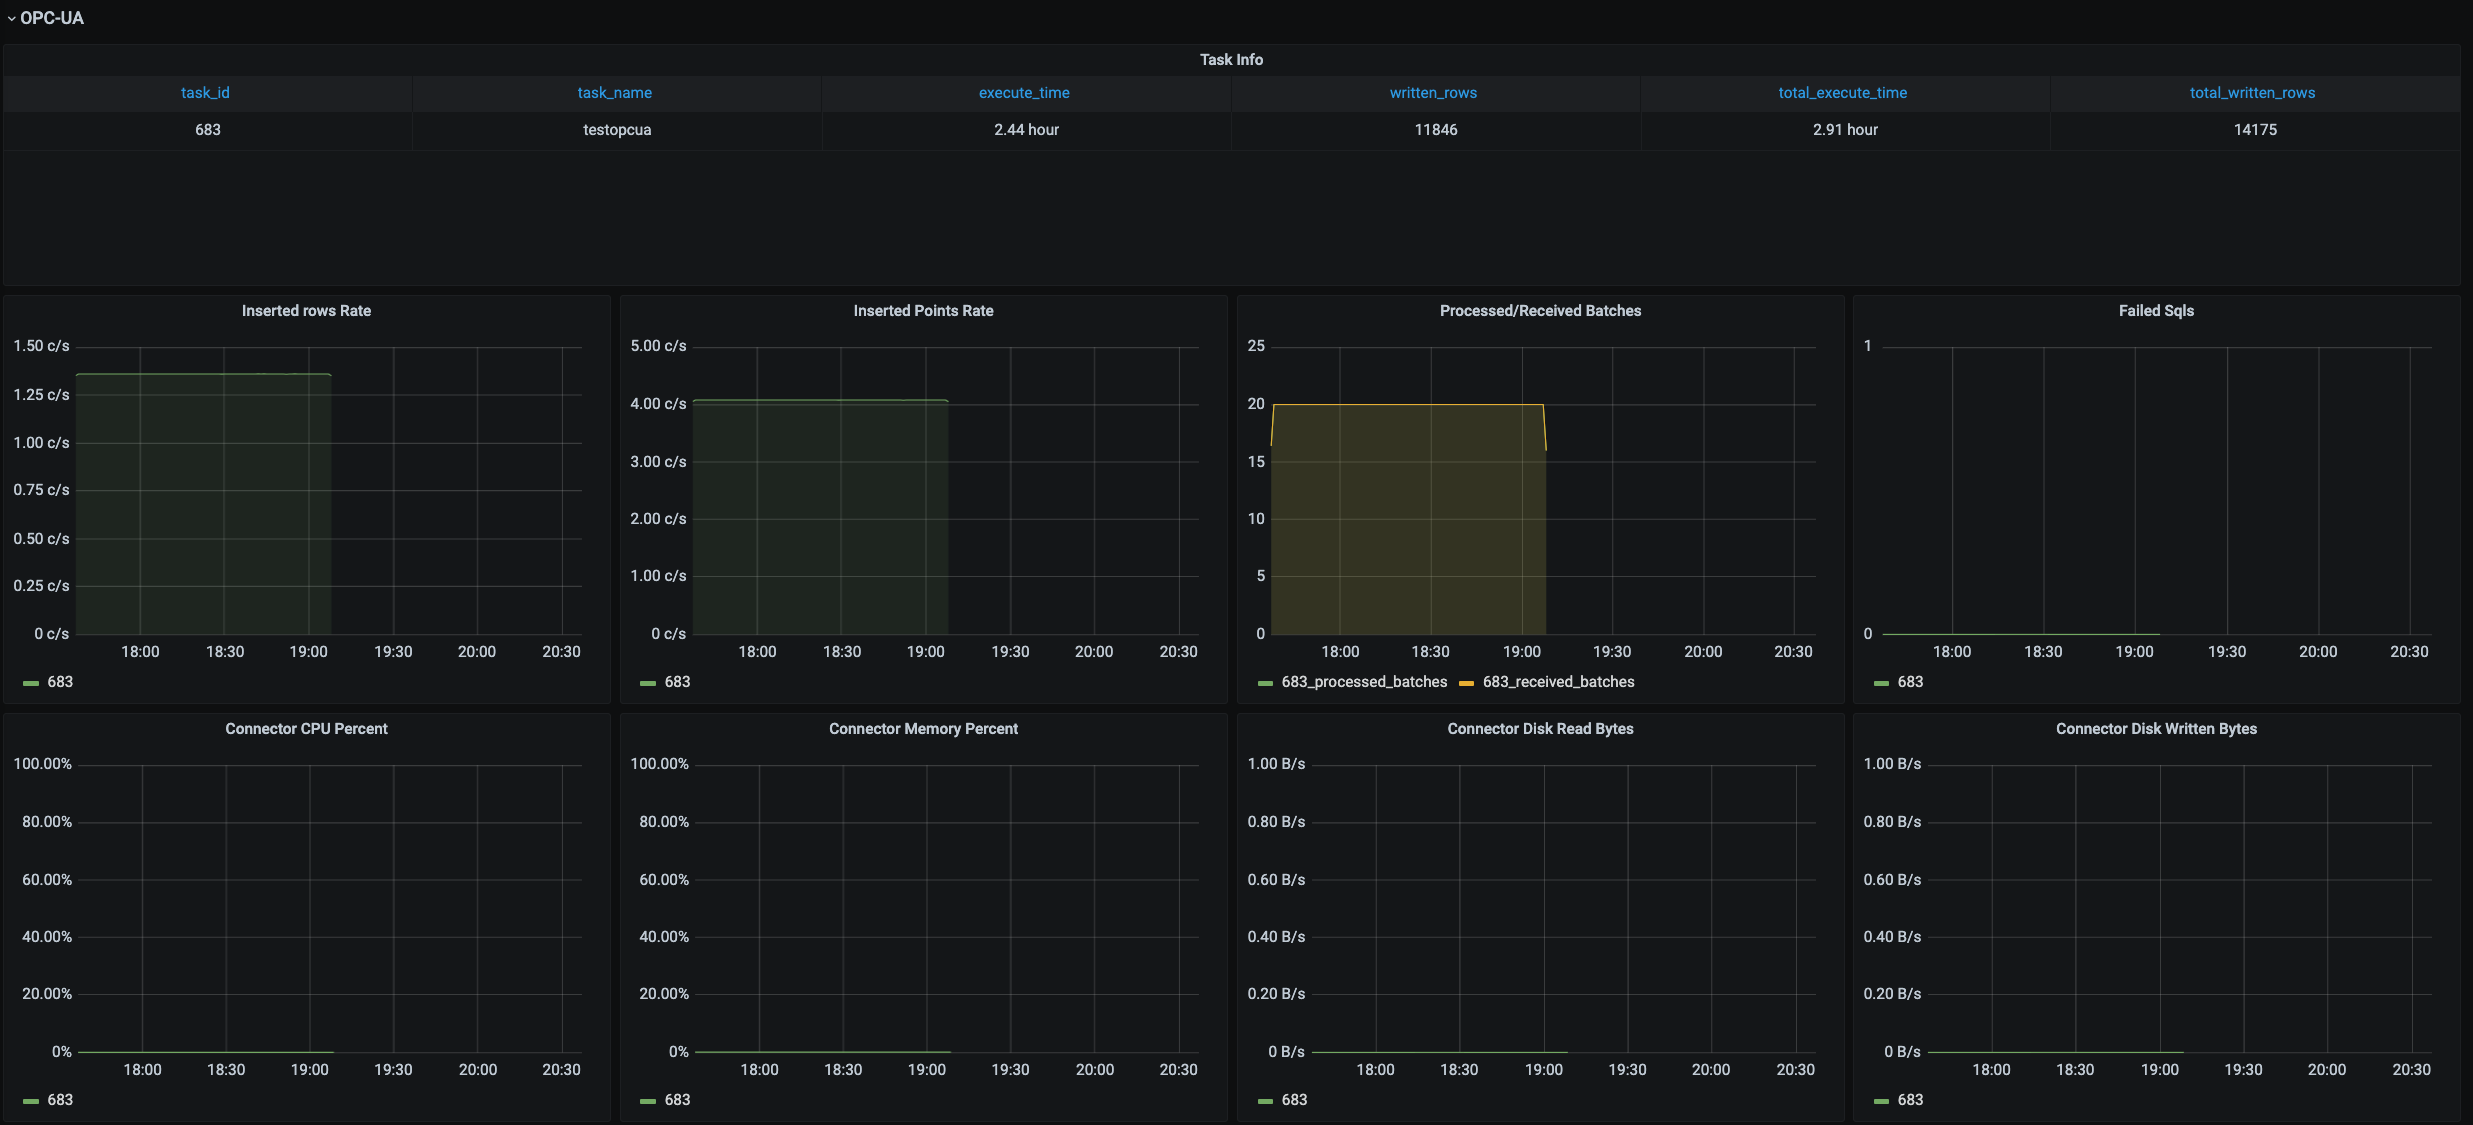
- Task Info: Task information, including id, name, execution time, number of rows written, total execution time, and total number of rows written.
- Inserted Rows Rate: Insertion rate of rows.
- Inserted Points Rate: Insertion rate of points.
- Processed/Received Batches: The number of batches processed & the number of data batches received through IPC Stream.
- Failed Sqls: The total number of failed INSERT SQL statements during this task run.
- Connector CPU Percent: The percentage of CPU usage by the Connector process, in time series form.
- Connector Memory Percent: The percentage of memory usage by the Connector process, in time series form.
- Connector Disk Read Rate: The disk read speed of the Connector process.
- Connector Disk Write Rate: The disk write speed of the Connector process.
The monitoring information of other types of data sources such as MQTT, CSV, Kafka, etc., is similar to OPC-UA.
Data source config
Collector config:
Upload an updated version of an exported dashboard.json file from Grafana
| Revision | Description | Created | |
|---|---|---|---|
| Download |