GrafanaCloud Monitoring / Billing / Usage
GrafanaCloud Monitoring / Billing / Usage using GrafanaCloud usage telemetry
GrafanaCloud Monitoring / Billing / Usage
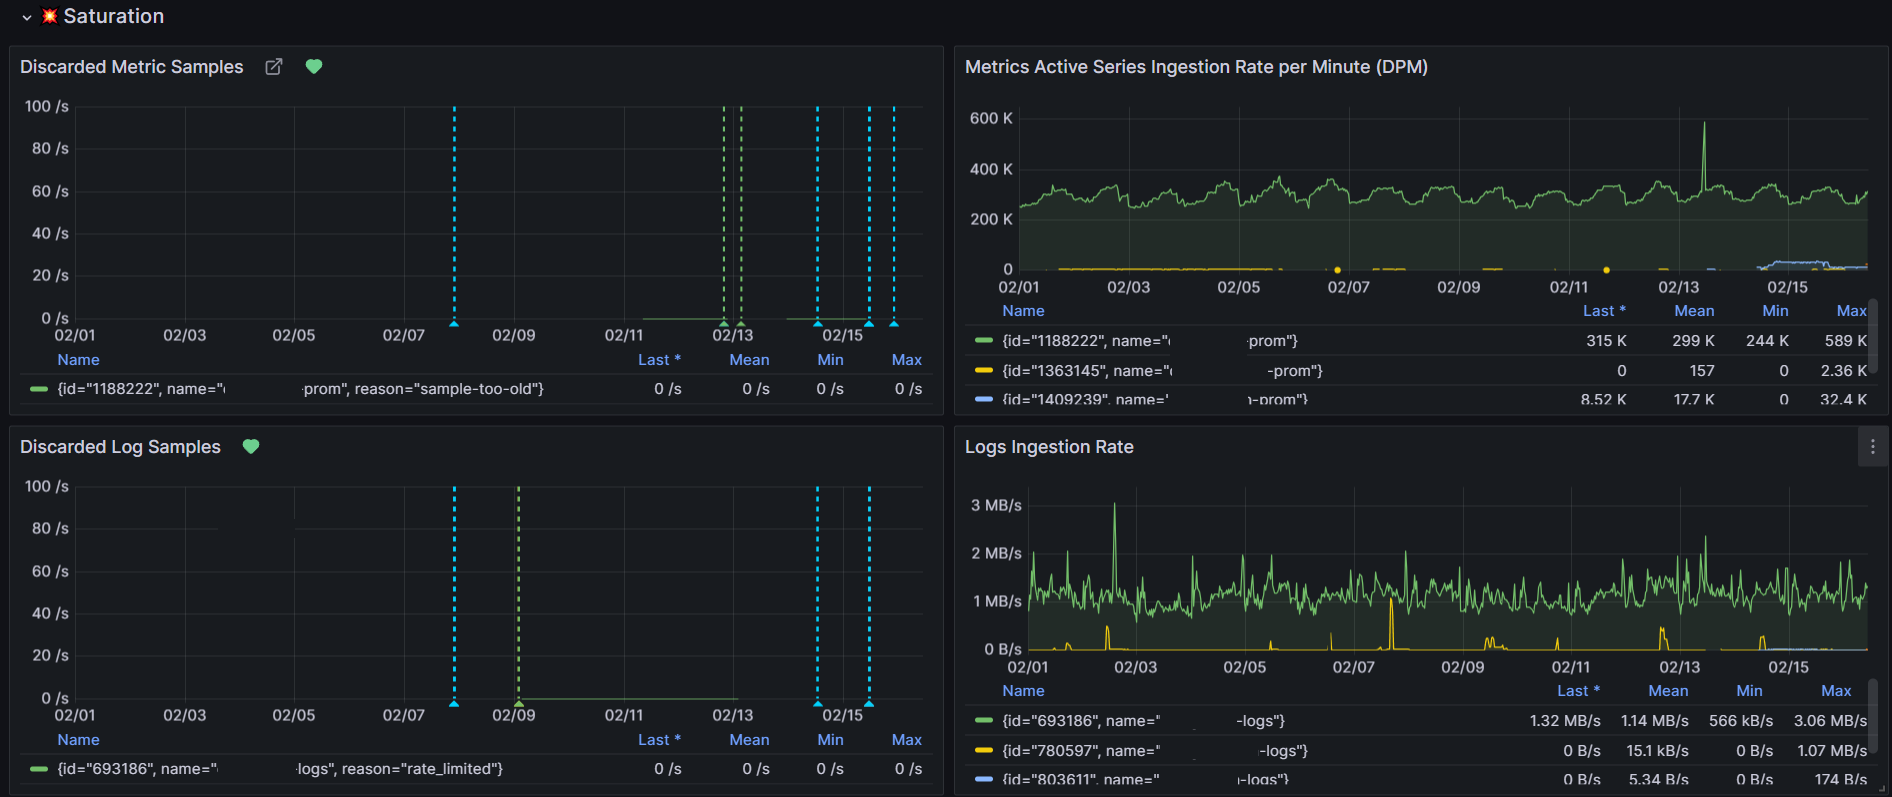
This dashboard helps GrafanaCloud admin to monitor telemetry rate limiting, drops and errors to increase quotas for GrafanaCloud.

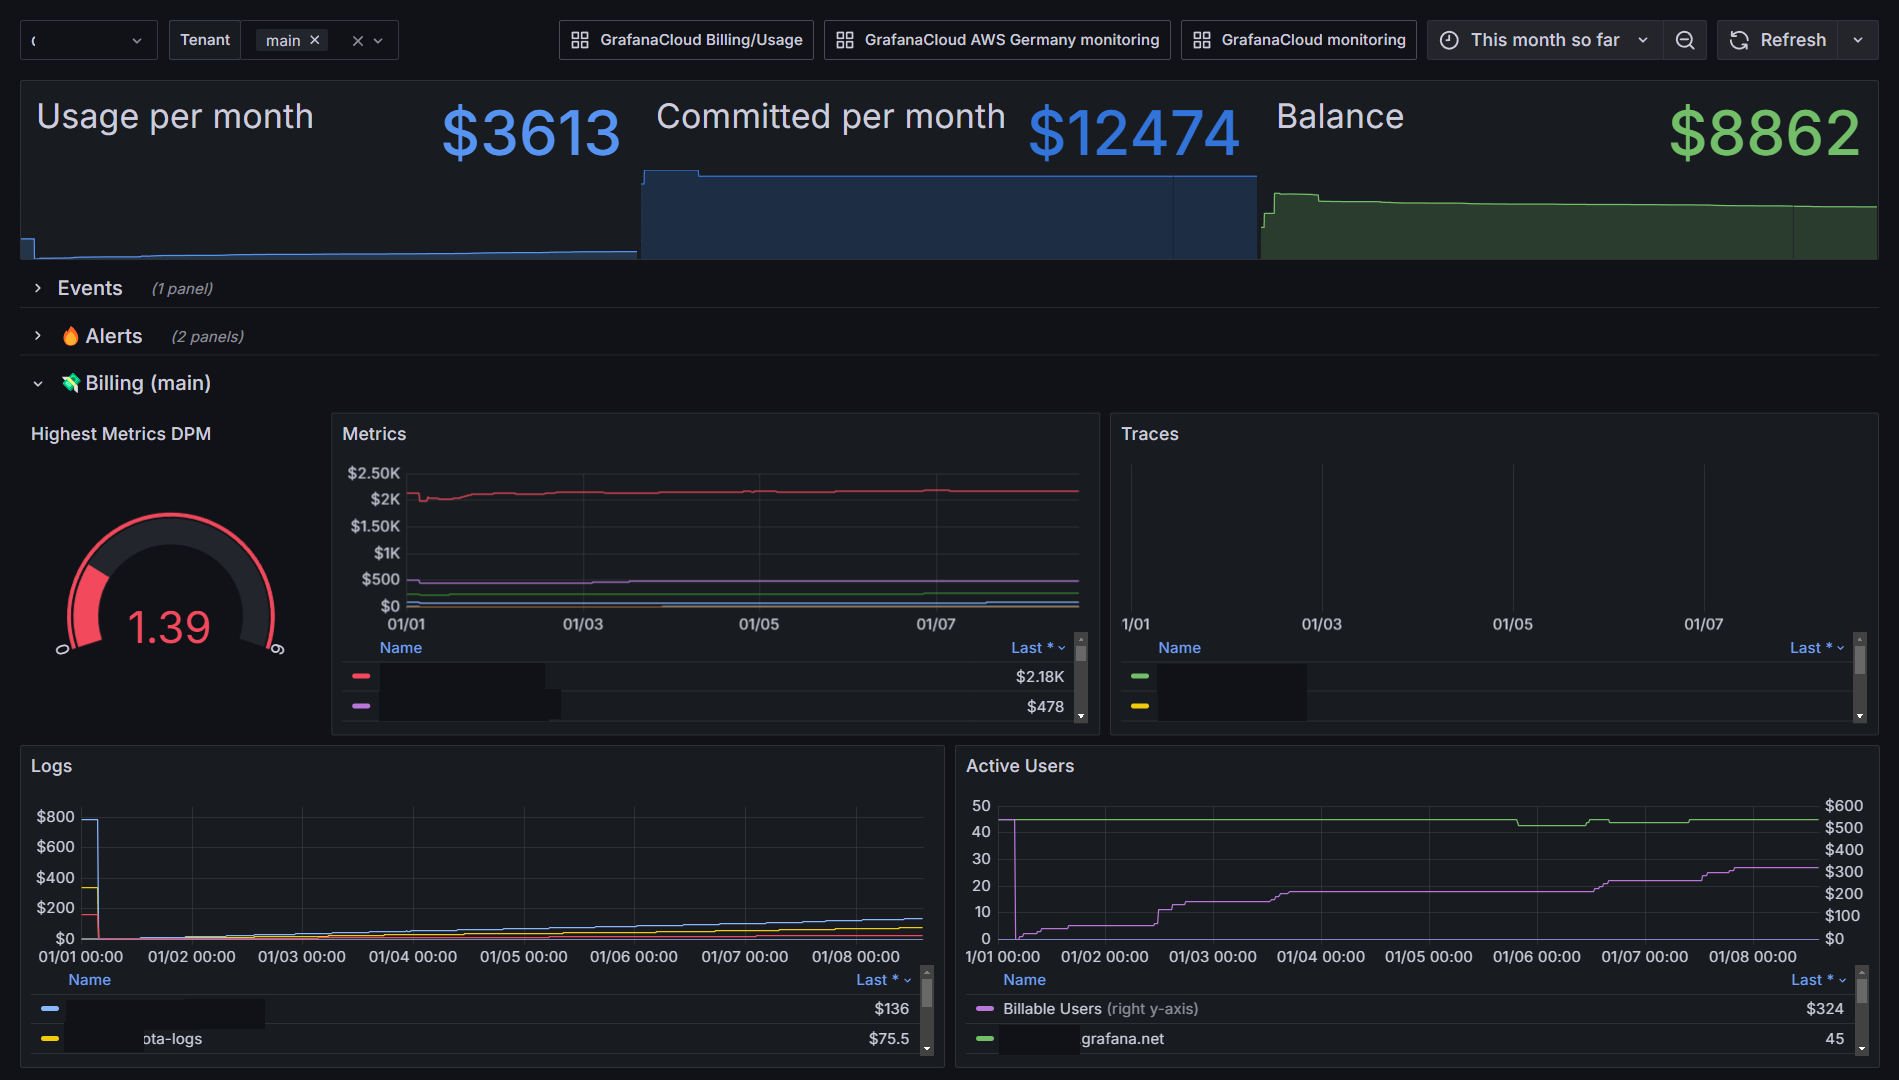
Costs

Alerting

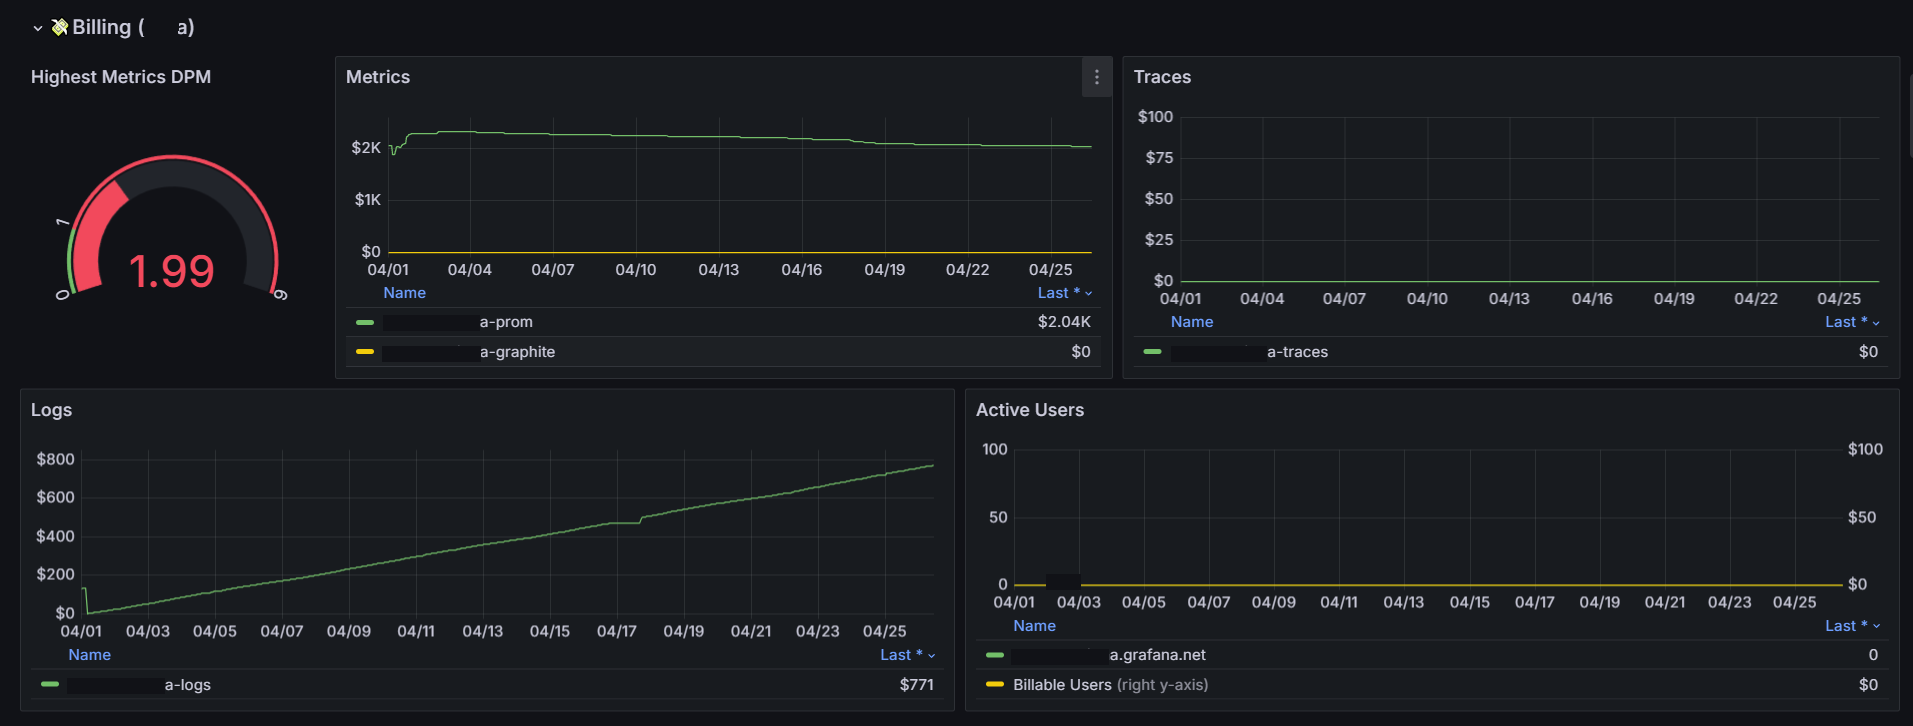
Billing per tenant

Billing usage

Saturation


Errors

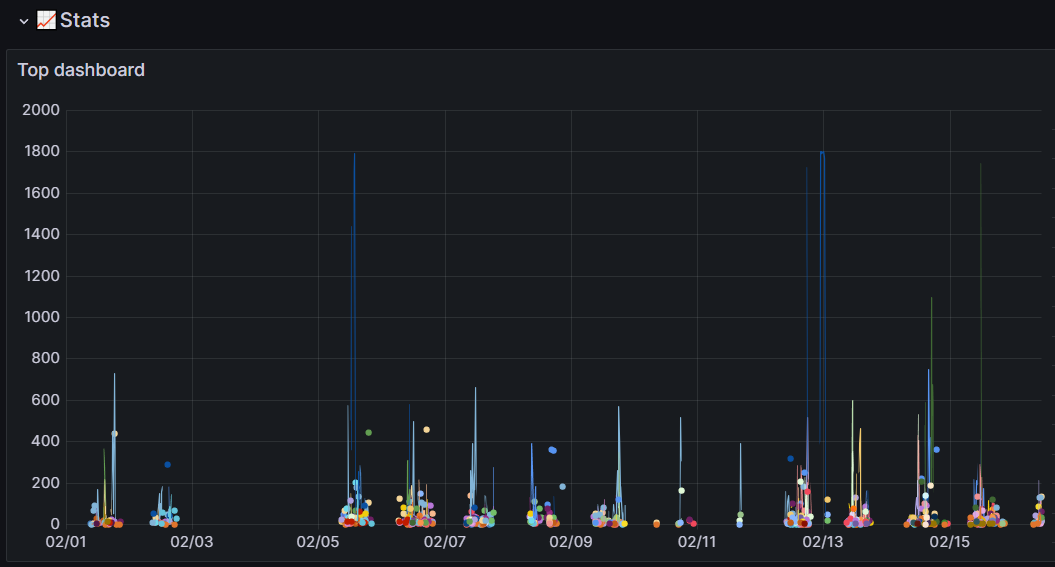
Top Dashboard

Data source config
Collector type:
Collector plugins:
Collector config:
Revisions
Upload an updated version of an exported dashboard.json file from Grafana
| Revision | Description | Created | |
|---|---|---|---|
| Download |


