Linux主机基础监控
基于prometheus数据源,展示linux基础监控项的图表,prometheus-2.47.1&grafana-10.0.5
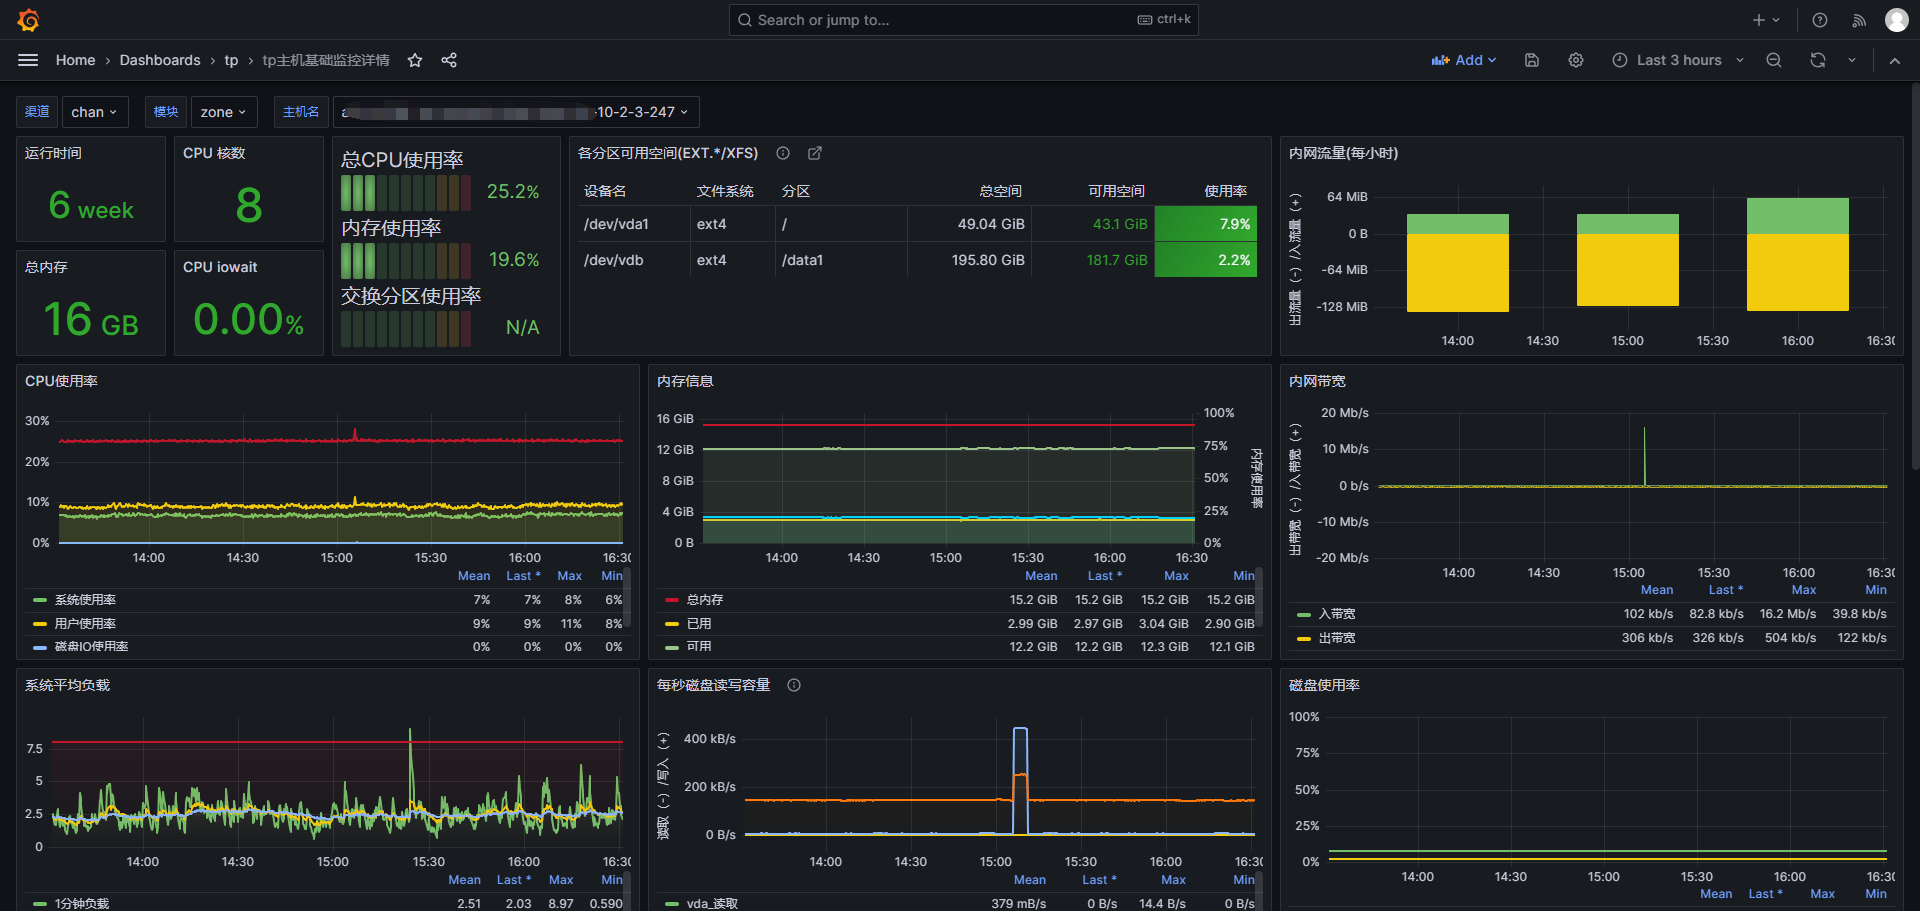
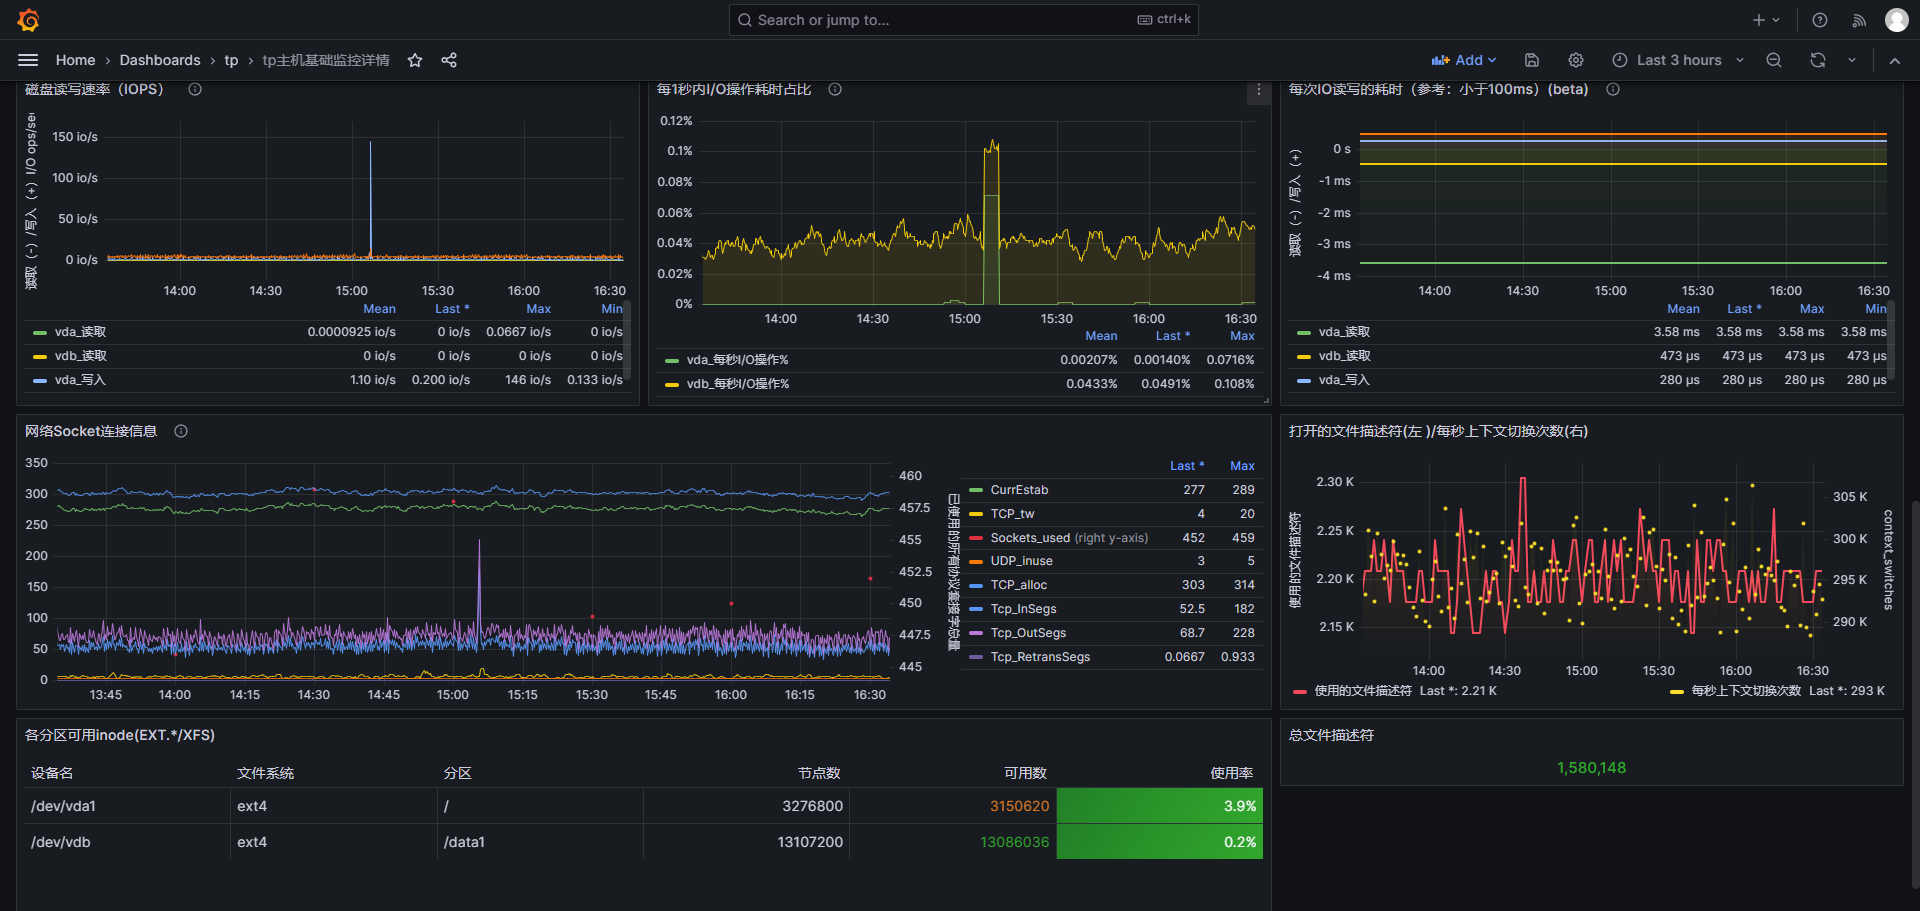
The Linux主机基础监控 dashboard uses the prometheus data source to create a Grafana dashboard with the bargauge, stat, table and timeseries panels.
Data source config
Collector type:
Collector plugins:
Collector config:
Revisions
Upload an updated version of an exported dashboard.json file from Grafana
| Revision | Description | Created | |
|---|---|---|---|
| Download |