Sagemcom F@st Metrics
Dashboard for the Sagemcom F@st Prometheus Exporter (https://github.com/hairyhenderson/sagemcom_fast_exporter).
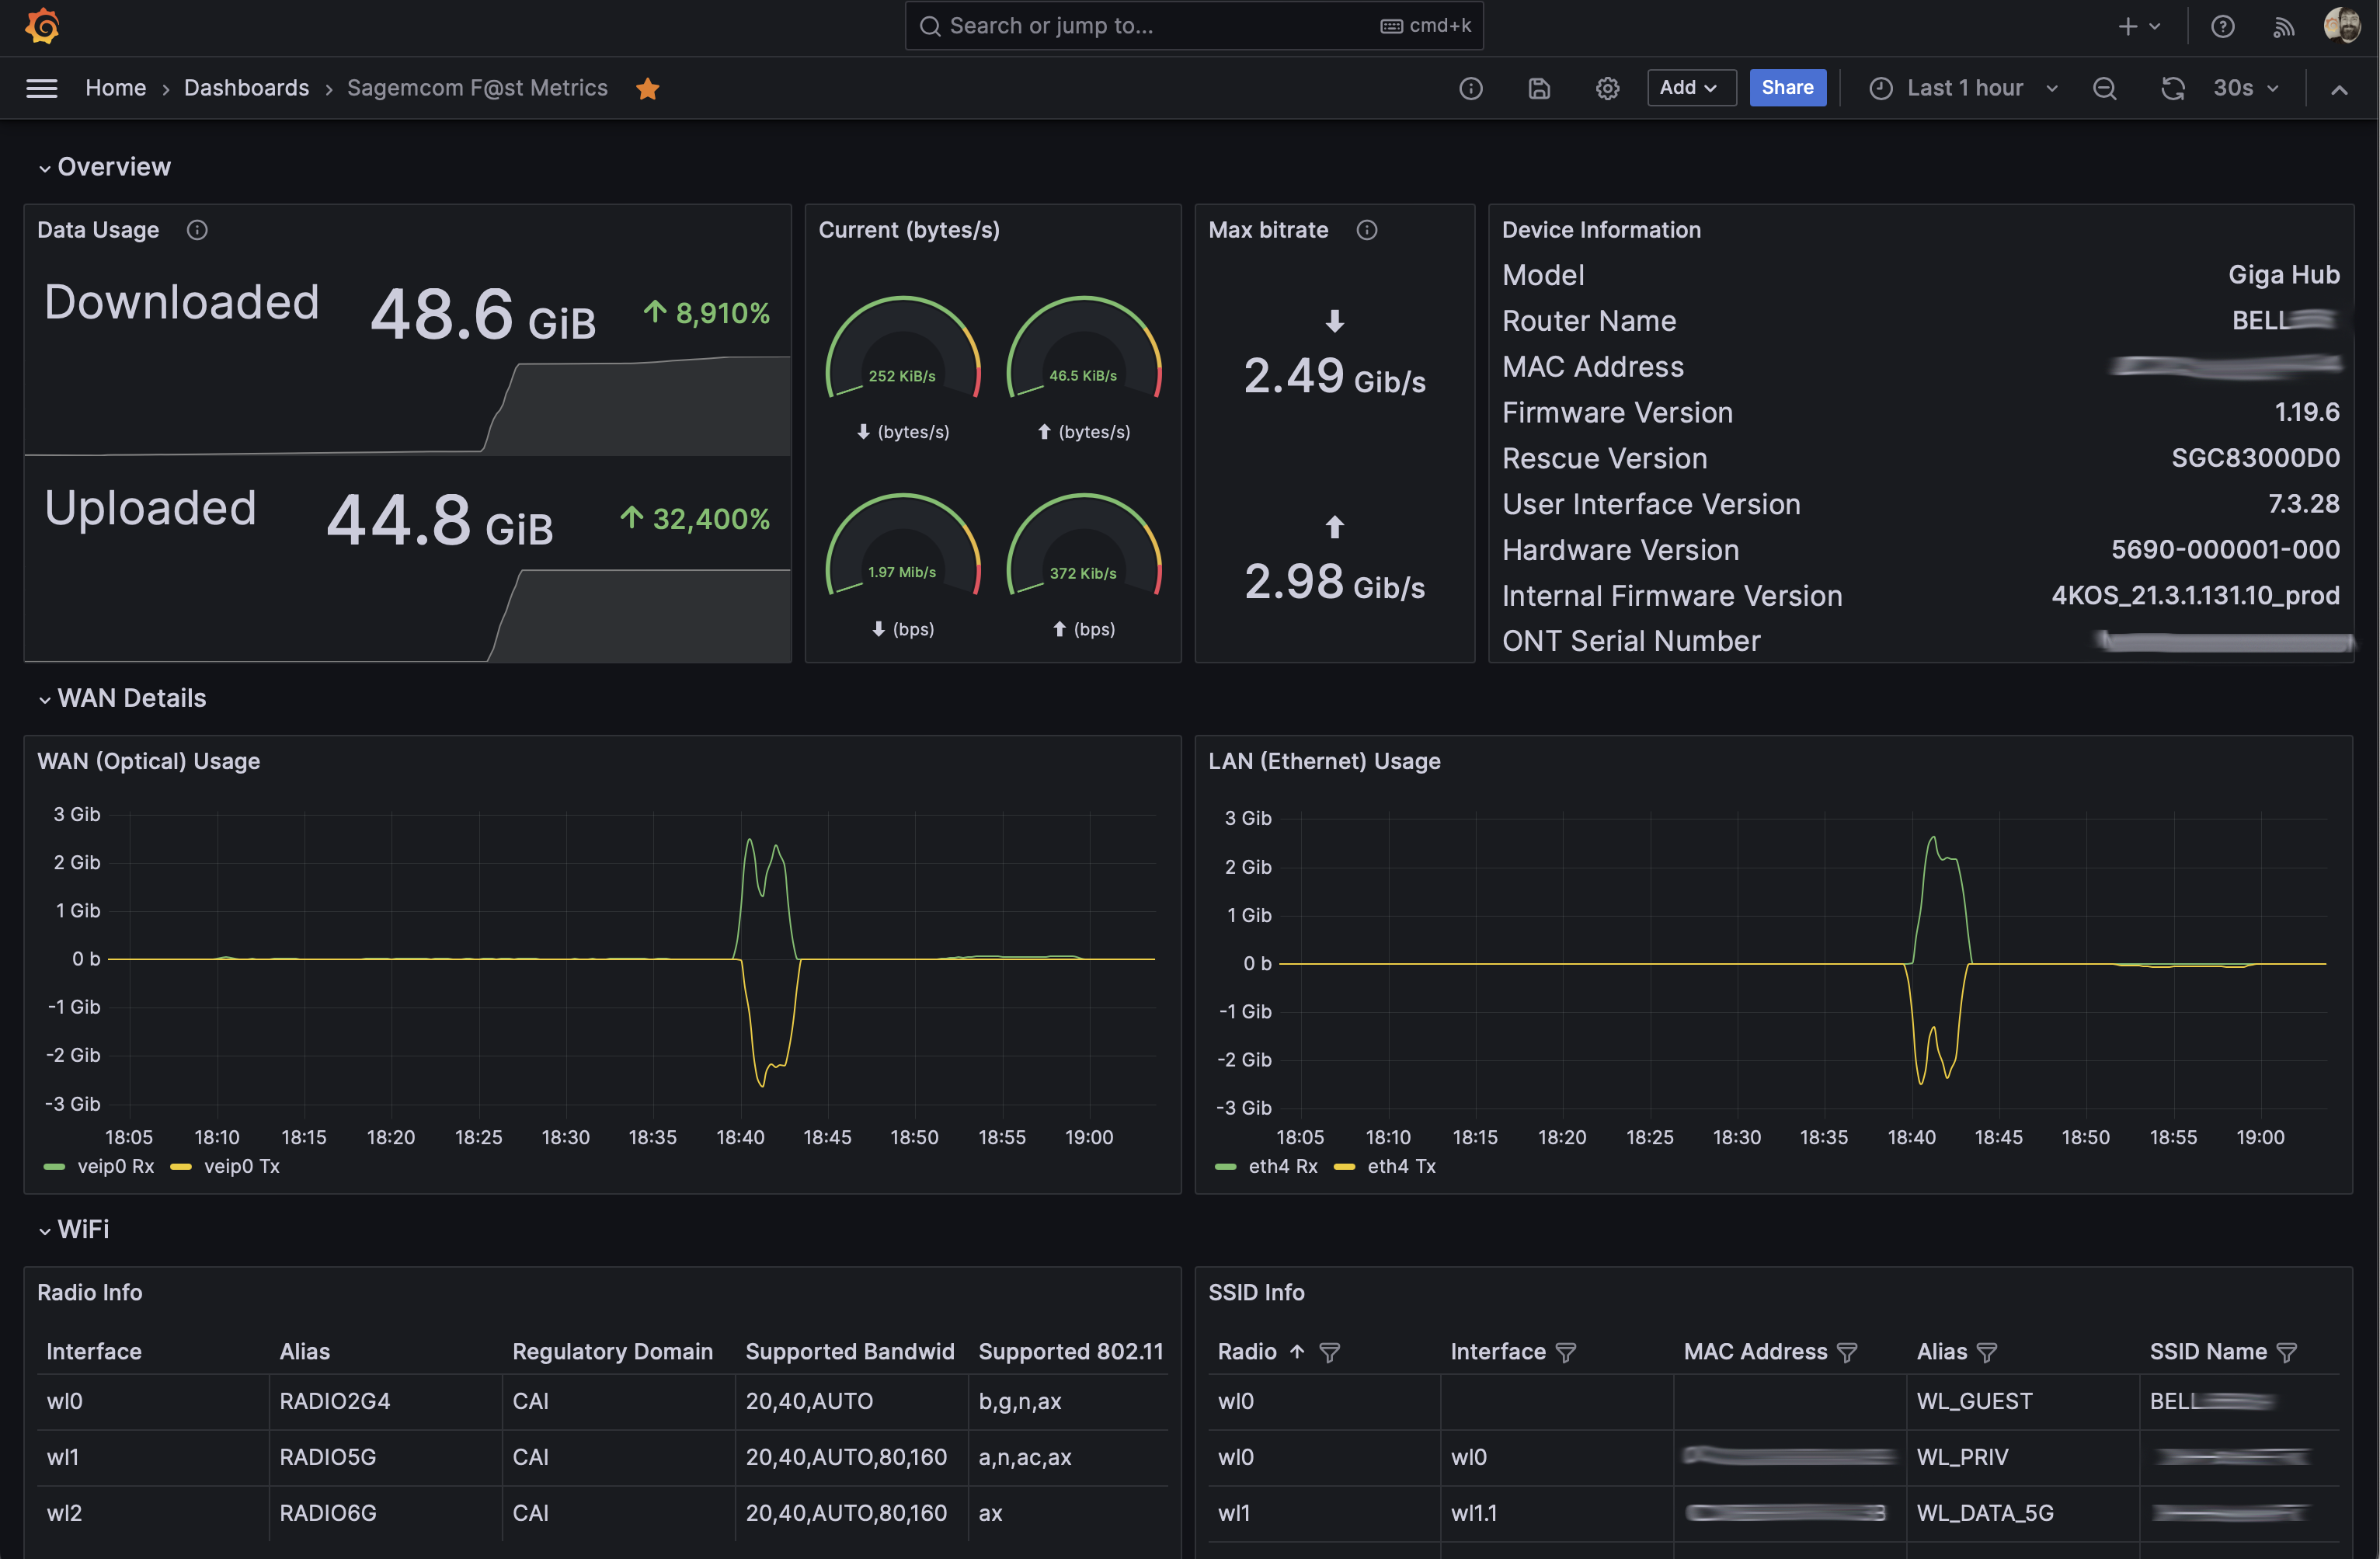
The Sagemcom F@st Metrics dashboard uses the __expr__ and prometheus data sources to create a Grafana dashboard with the gauge, heatmap, stat, state-timeline, table and timeseries panels.
Data source config
Collector type:
Collector plugins:
Collector config:
Revisions
Upload an updated version of an exported dashboard.json file from Grafana
| Revision | Description | Created | |
|---|---|---|---|
| Download |