Node and Container Alerts
This dashboard shows cpu, memory and disk stats for linux and container nodes. Default alerts are configured for linux nodes.
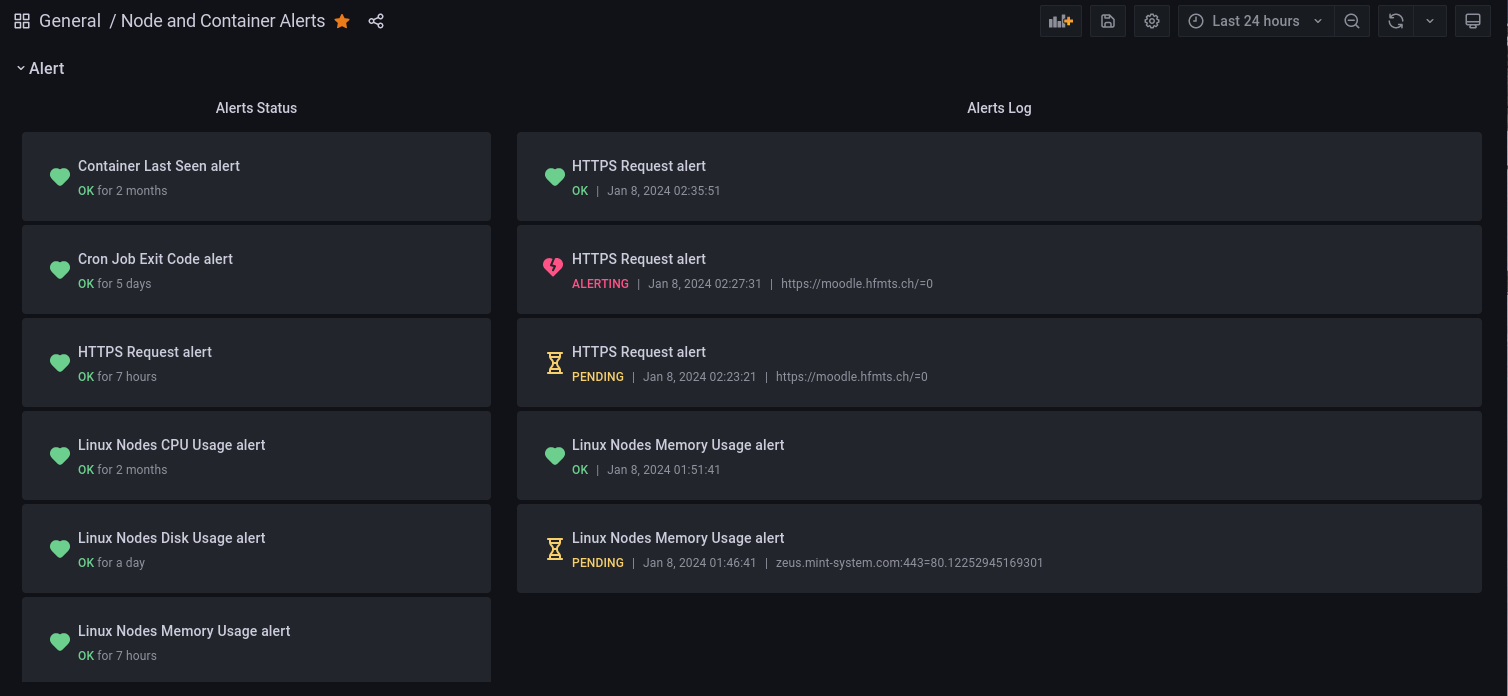
The Node and Container Alerts dashboard uses the prometheus data source to create a Grafana dashboard with the alertlist and timeseries panels.
Data source config
Collector type:
Collector plugins:
Collector config:
Revisions
Upload an updated version of an exported dashboard.json file from Grafana
| Revision | Description | Created | |
|---|---|---|---|
| Download |
Linux Server
Monitor Linux with Grafana. Easily monitor your Linux deployment with Grafana Cloud's out-of-the-box monitoring solution.
Learn more