Response, Ping & DNS Tests
Dashboard giving you an overview of the HTTP responses, ping results and DNS queries.
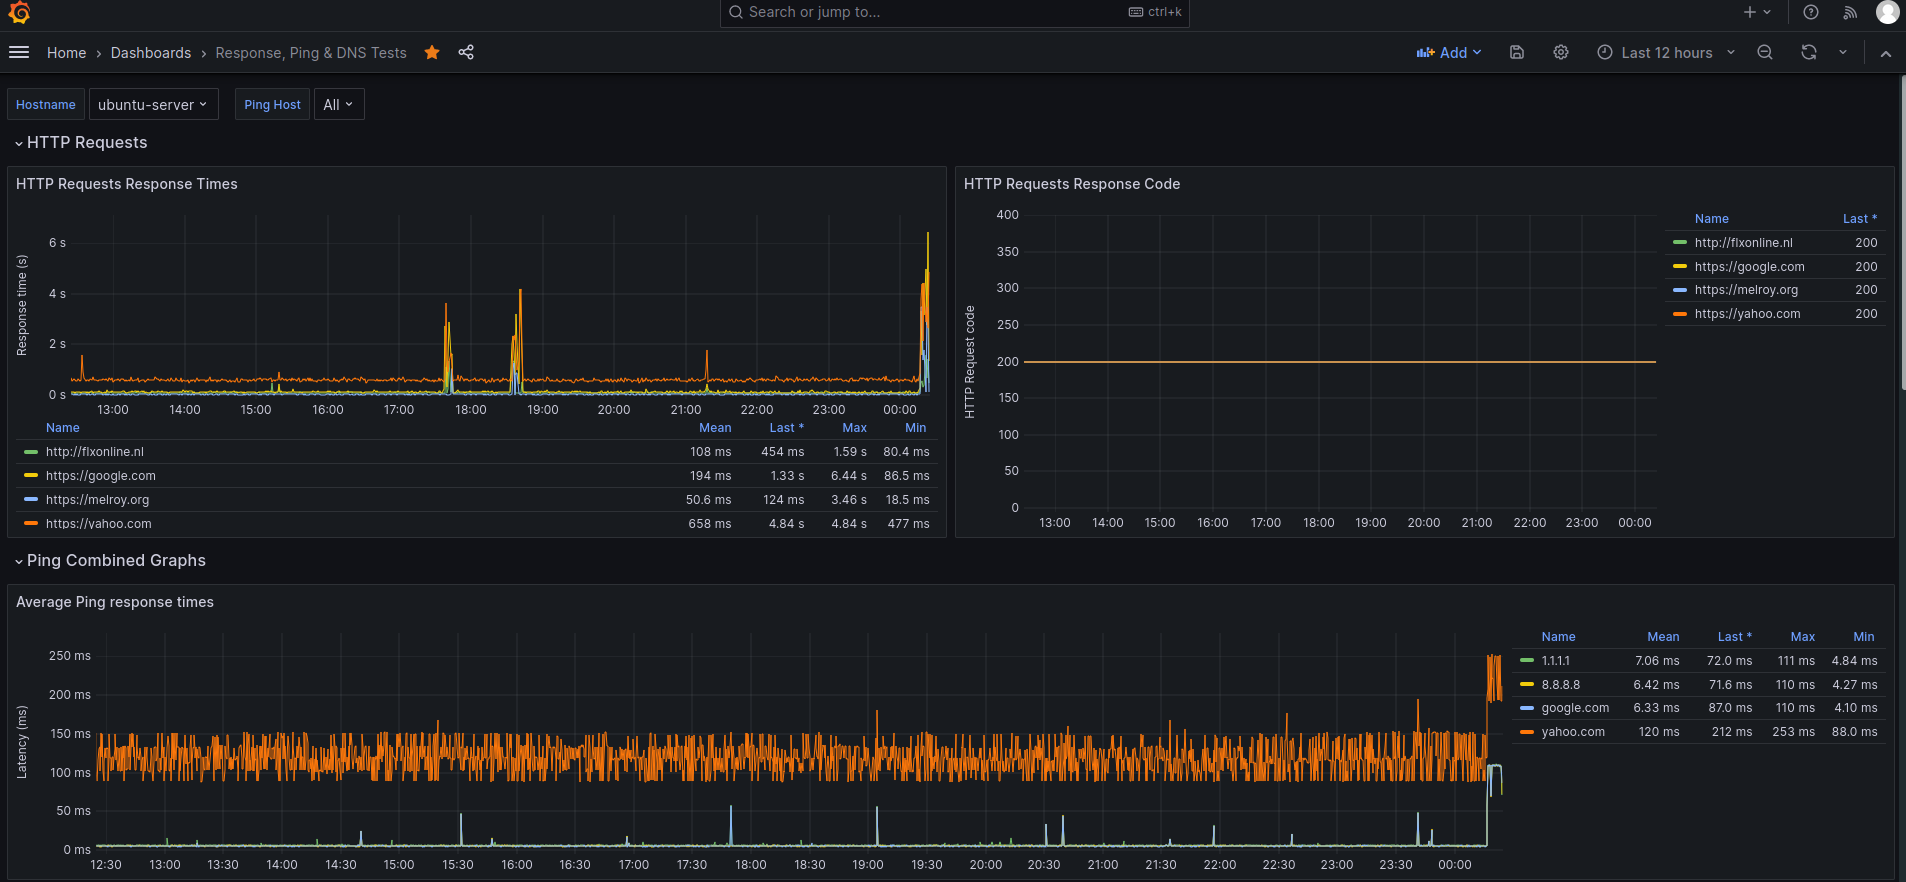
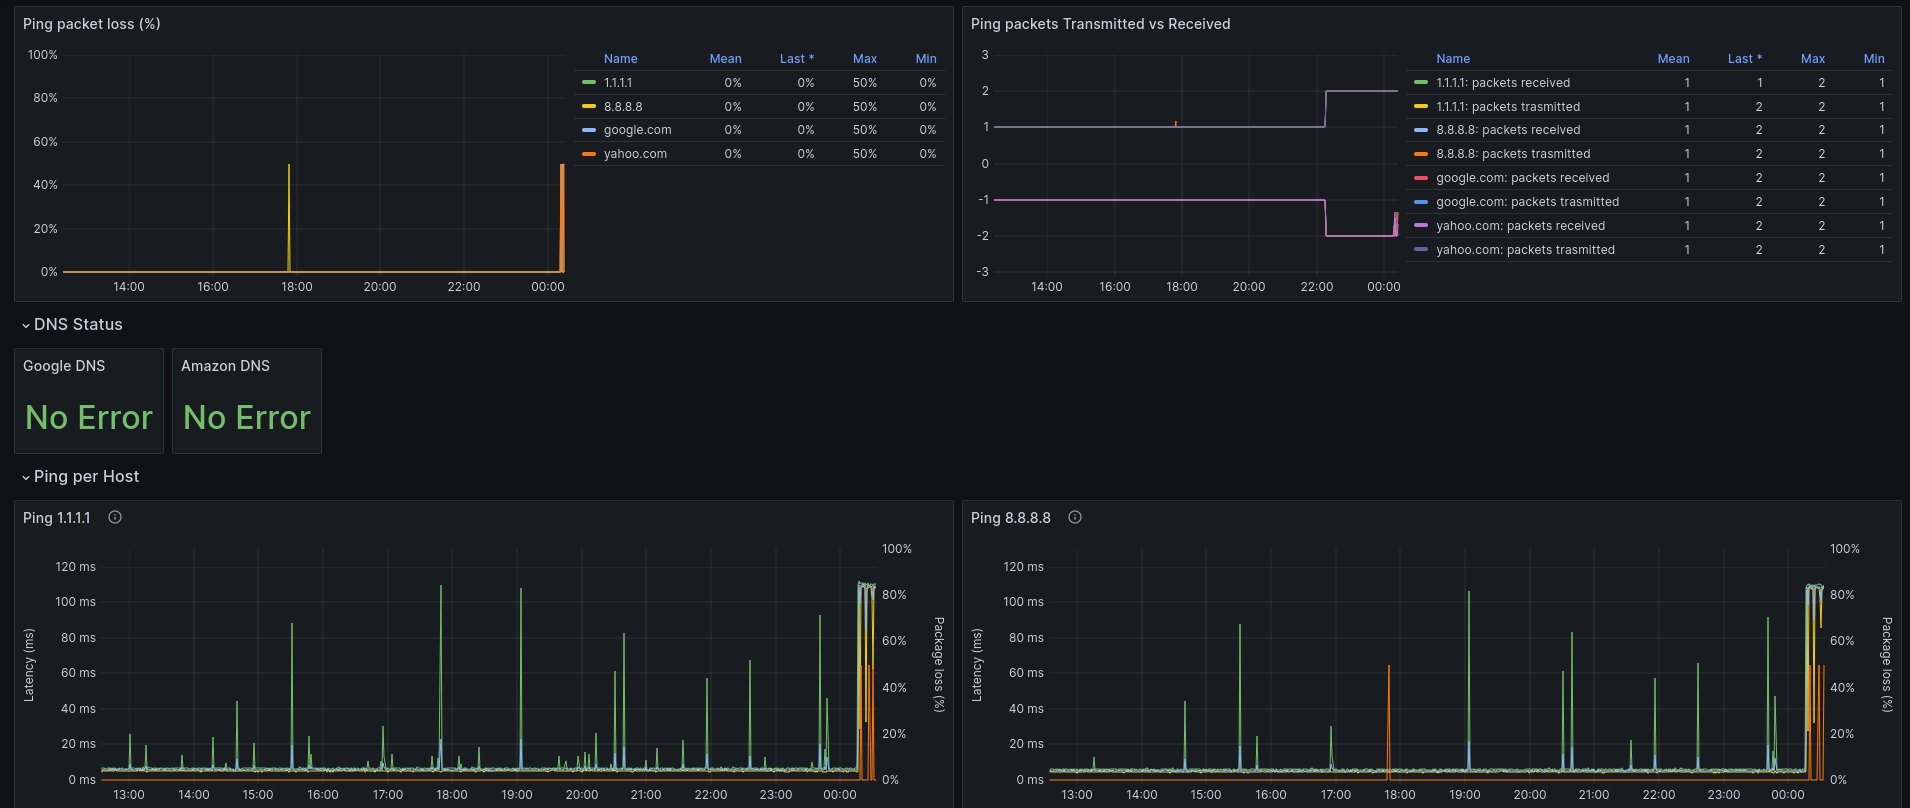
A powerful yet simple dashboard giving you insides into HTTP Response times, Ping latency and DNS status information.
Data is collected via Telegraf and inserted into InfluxDB (v1). The collected HTTP Requests, ping tests and DNS query results can then be visualized into a single dashboard. See configuration snippet below for the Telegraf configuration (/etc/telegraf/telegraf.conf).
Data source config
Collector type:
Collector plugins:
Collector config:
Revisions
Upload an updated version of an exported dashboard.json file from Grafana
| Revision | Description | Created | |
|---|---|---|---|
| Download |