Unleash
This Grafana dashboard is designed to provide a comprehensive overview of the Unleash server's performance metrics, feature toggle usage, and system health status. It aims to empower administrators and developers with critical insights into the Unleash server's behavior and facilitate informed decision-making.
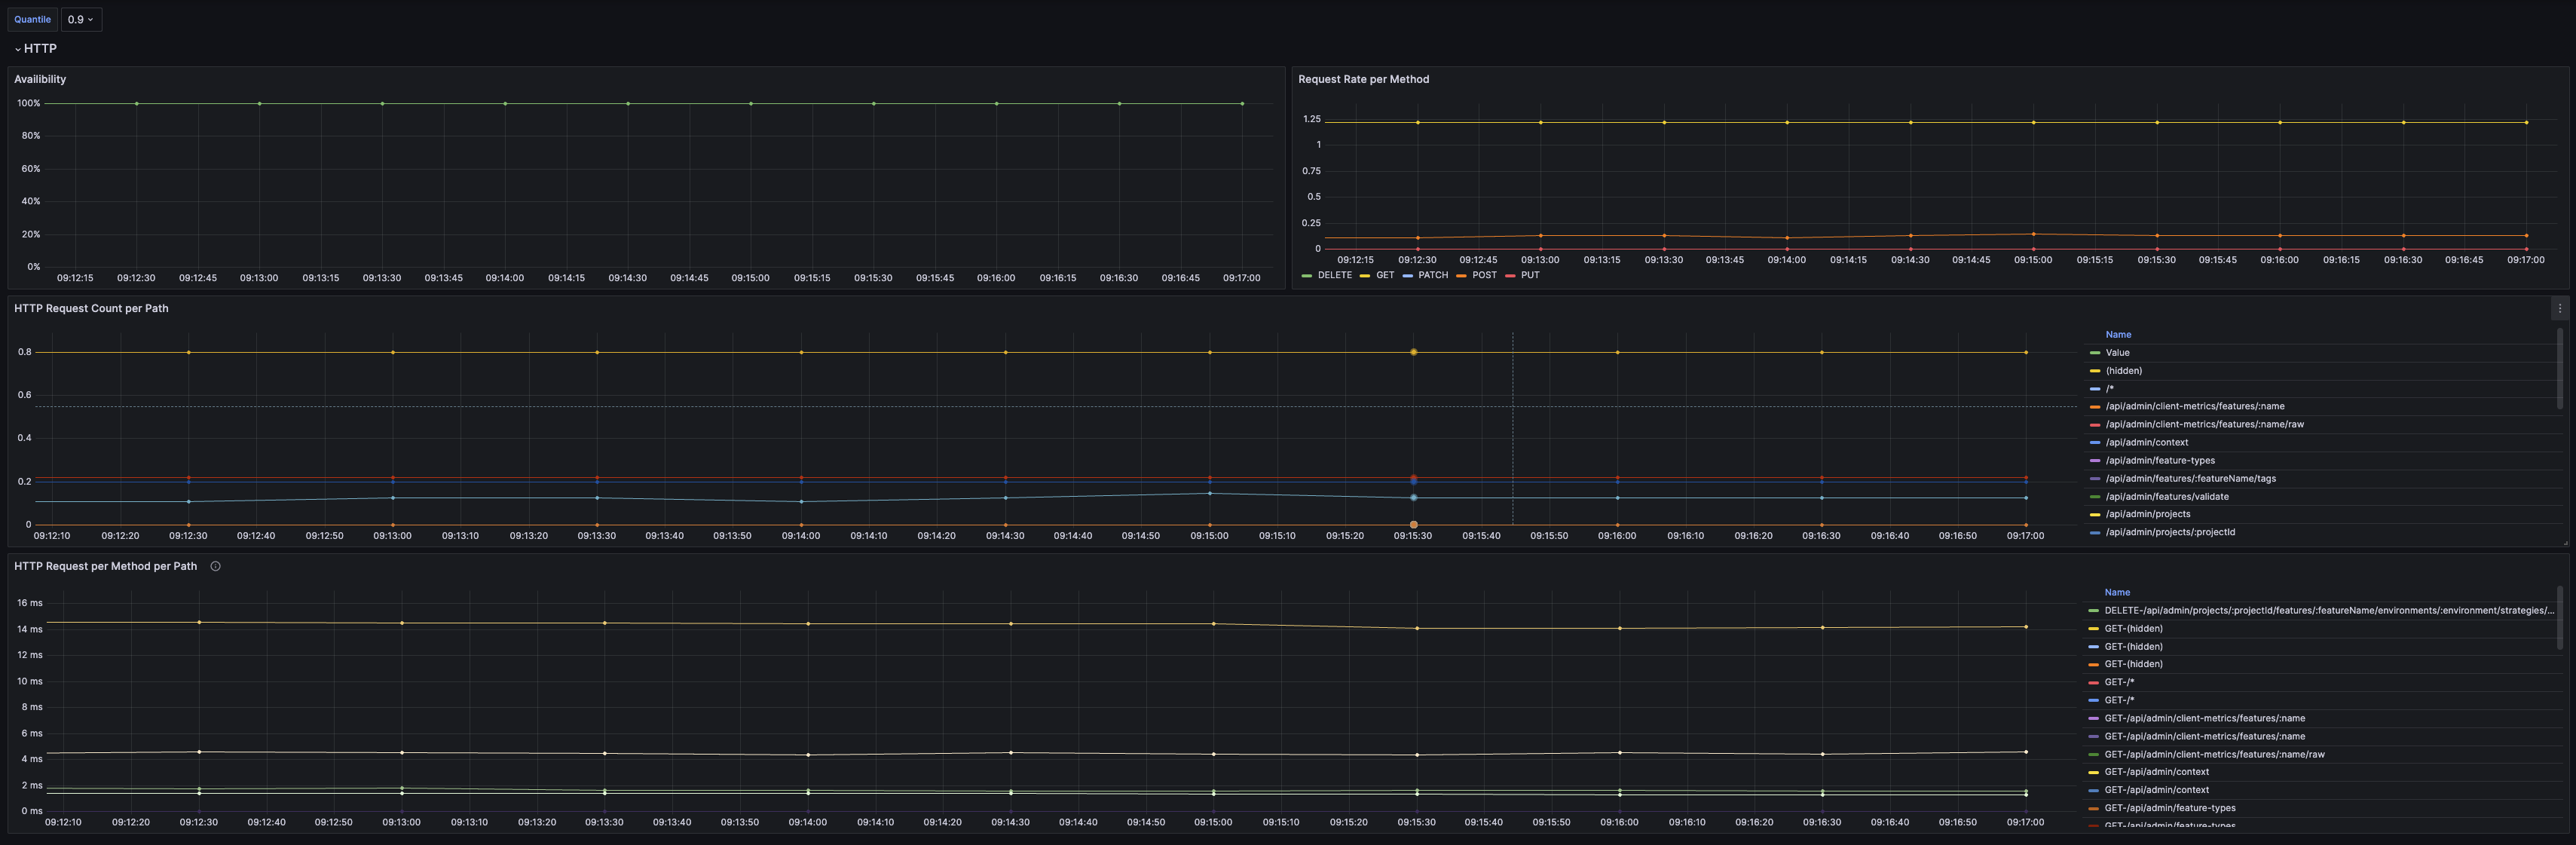
The Unleash dashboard uses the prometheus data source to create a Grafana dashboard with the bargauge, piechart, stat and timeseries panels.
Data source config
Collector type:
Collector plugins:
Collector config:
Revisions
Upload an updated version of an exported dashboard.json file from Grafana
| Revision | Description | Created | |
|---|---|---|---|
| Download |