Windows Server Overview
After importing the Windows Server Overview Dashboard, it will display as presented (please note that certain data has been obscured in the images for privacy reasons).
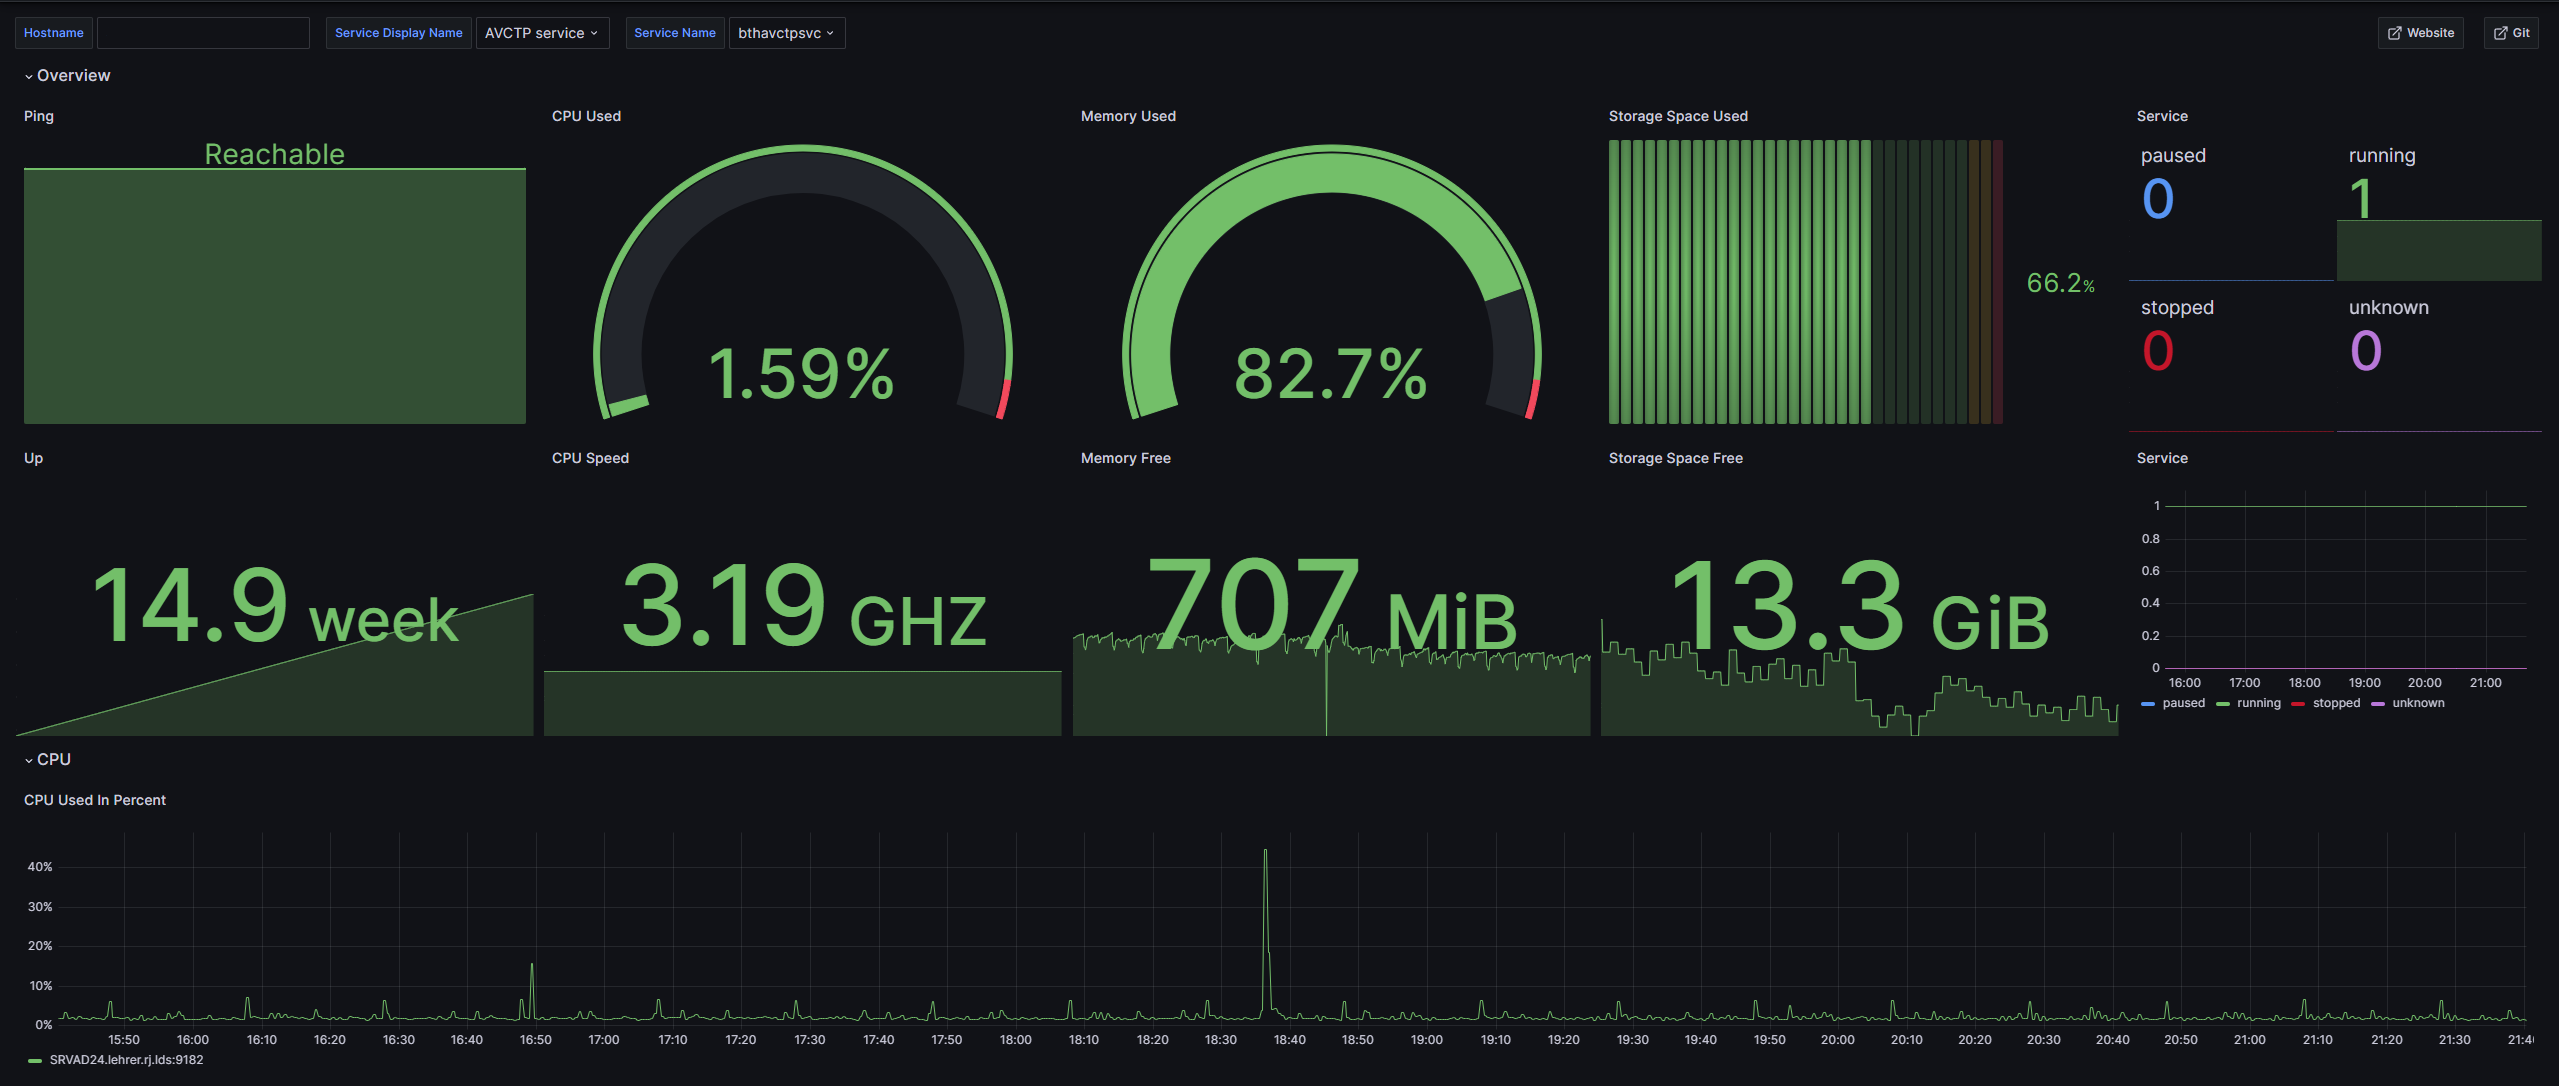
This dashboard provides an overview of the current metrics for your Windows server:
- Ping (Is the server online)
- Up (Duration of server uptime)
- CPU Utilization (Current CPU usage percentage)
- CPU Speed (The operating speed of your CPU)
- Used Memory (Memory usage percentage)
- Free Memory (Available memory in bytes)
- Used Storage Space (Storage usage percentage)
- Free Storage Space (Available storage in bytes)
- Service (View the status of a defined service)
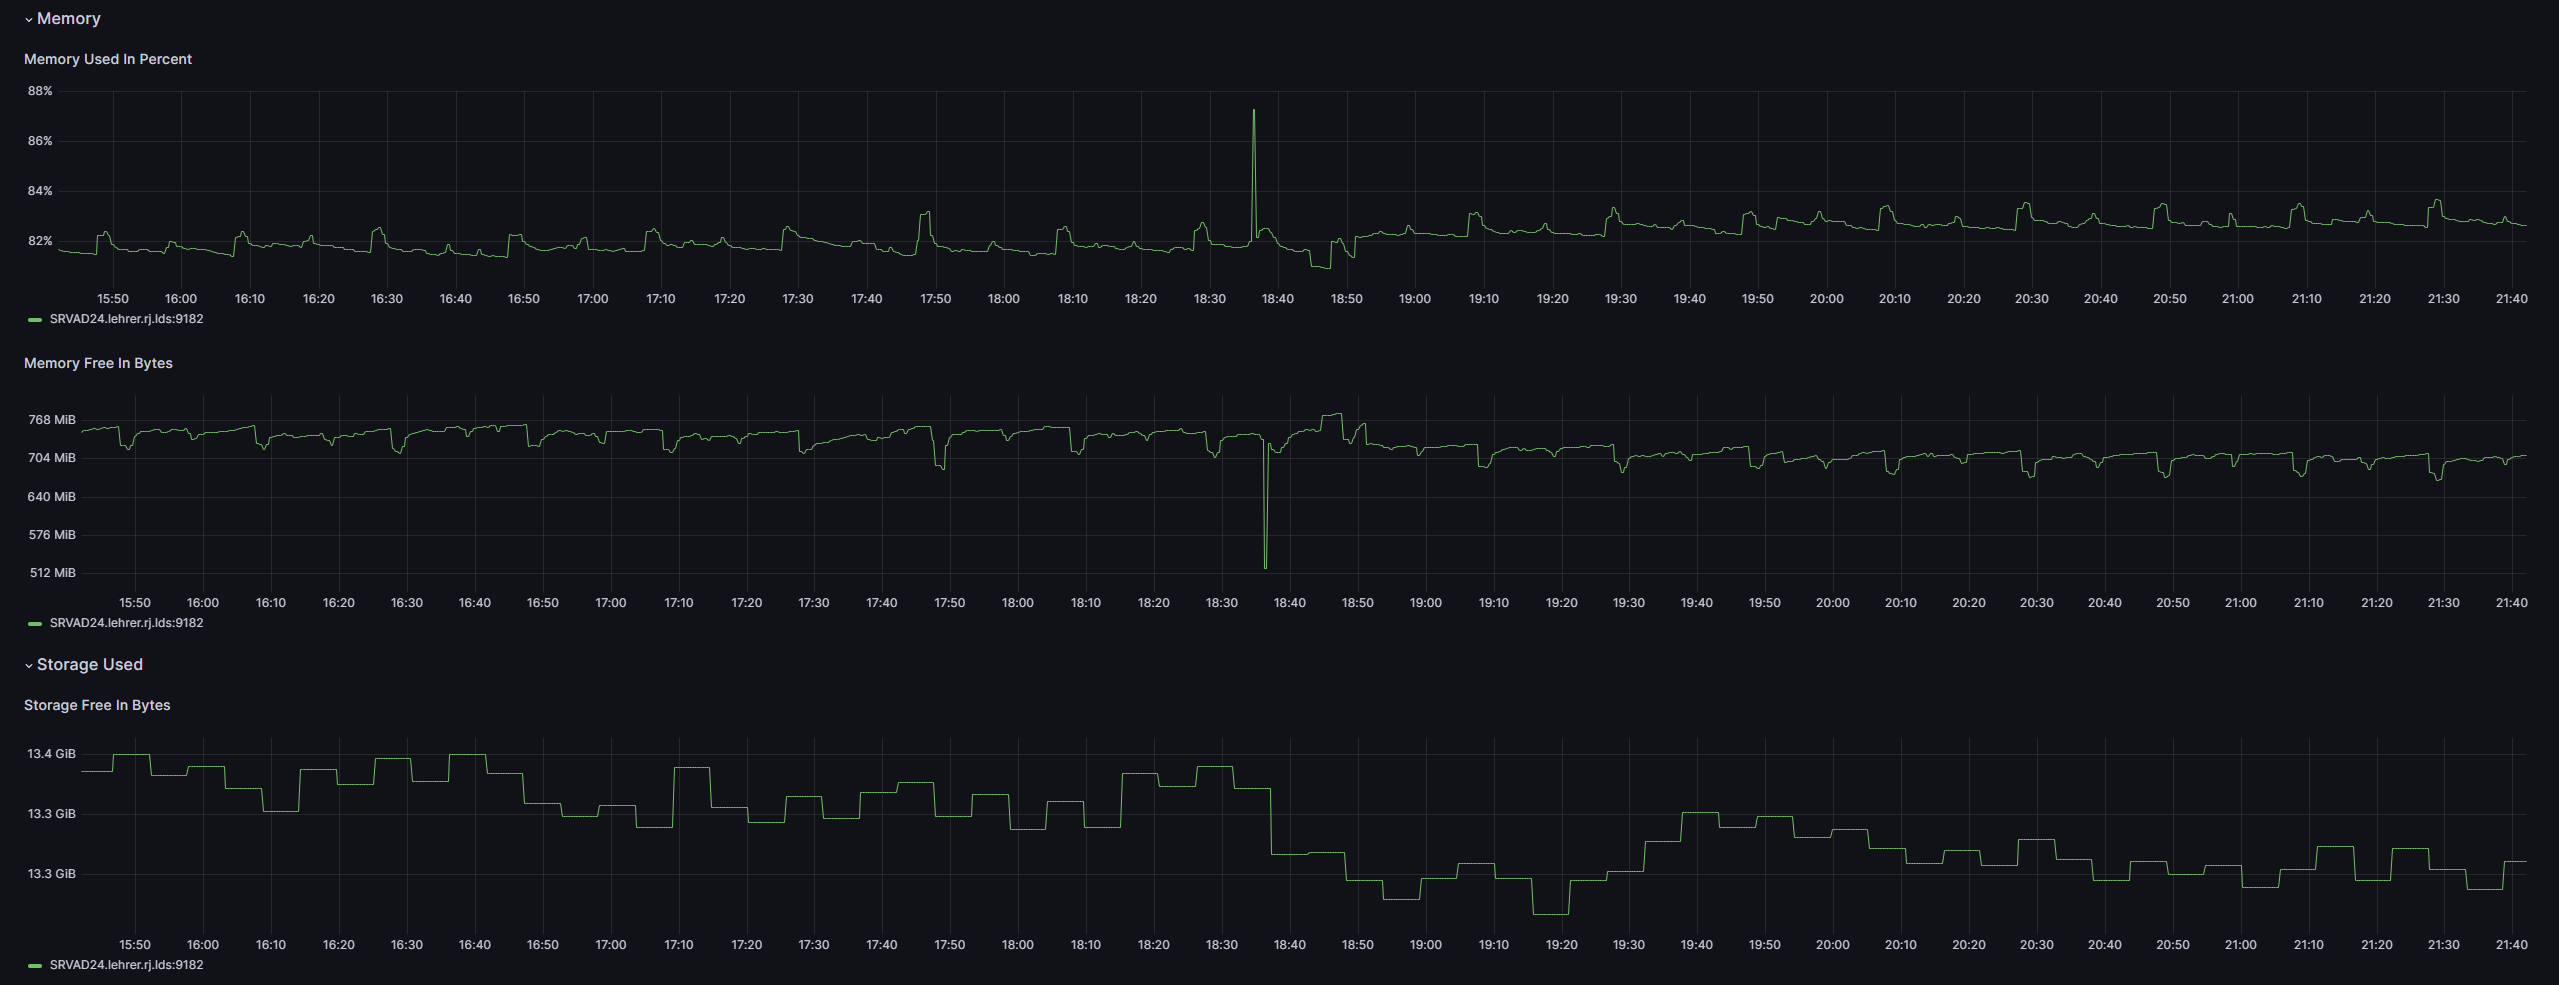
Additionally, you can track the historical changes in some metrics:
- CPU Used (Historical CPU load changes)
- Memory (Historical changes in free memory)
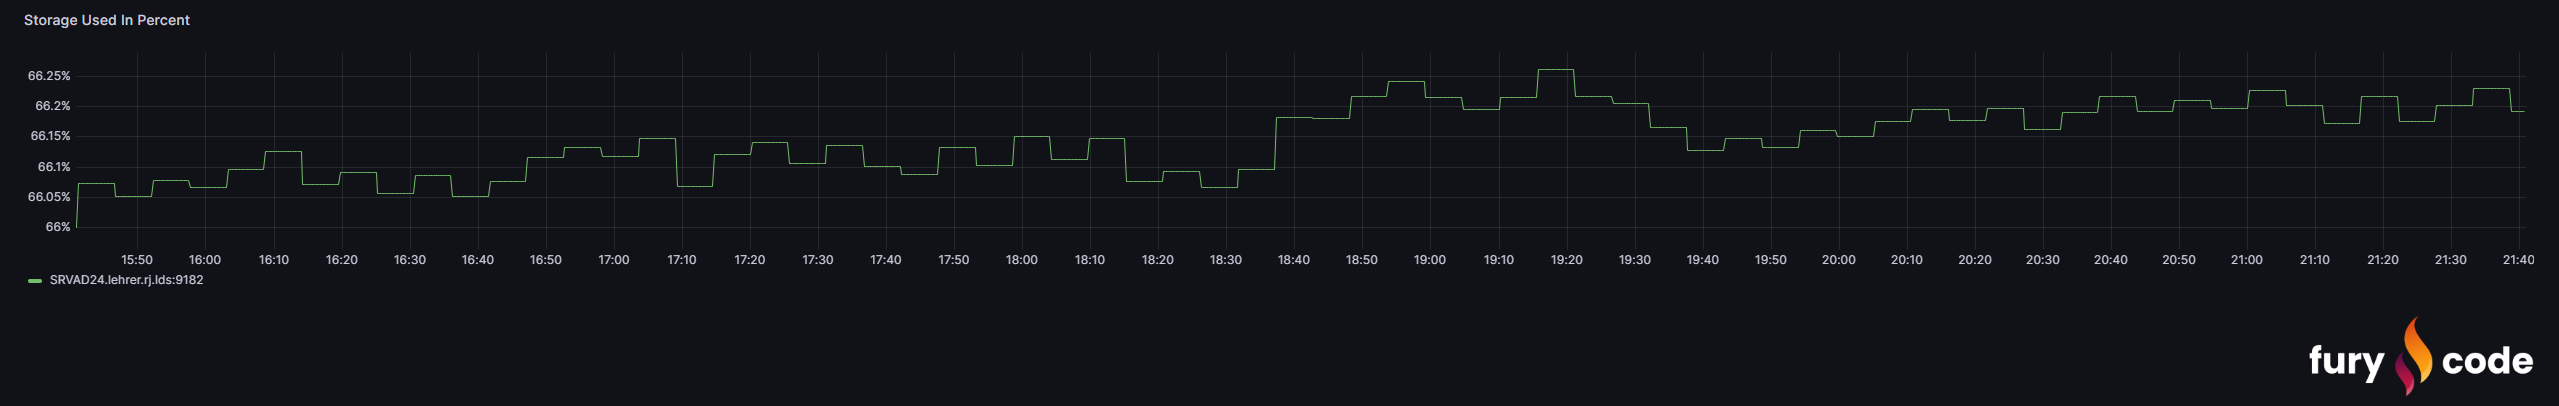
- Storage Used (Historical changes in available disk space)
You can find more information here: Git
Data source config
Collector type:
Collector plugins:
Collector config:
Revisions
Upload an updated version of an exported dashboard.json file from Grafana
| Revision | Description | Created | |
|---|---|---|---|
| Download |
Windows
Easily monitor your deployment of the Windows operating system with Grafana Cloud's out-of-the-box monitoring solution.
Learn more