ArvanCloud CDN
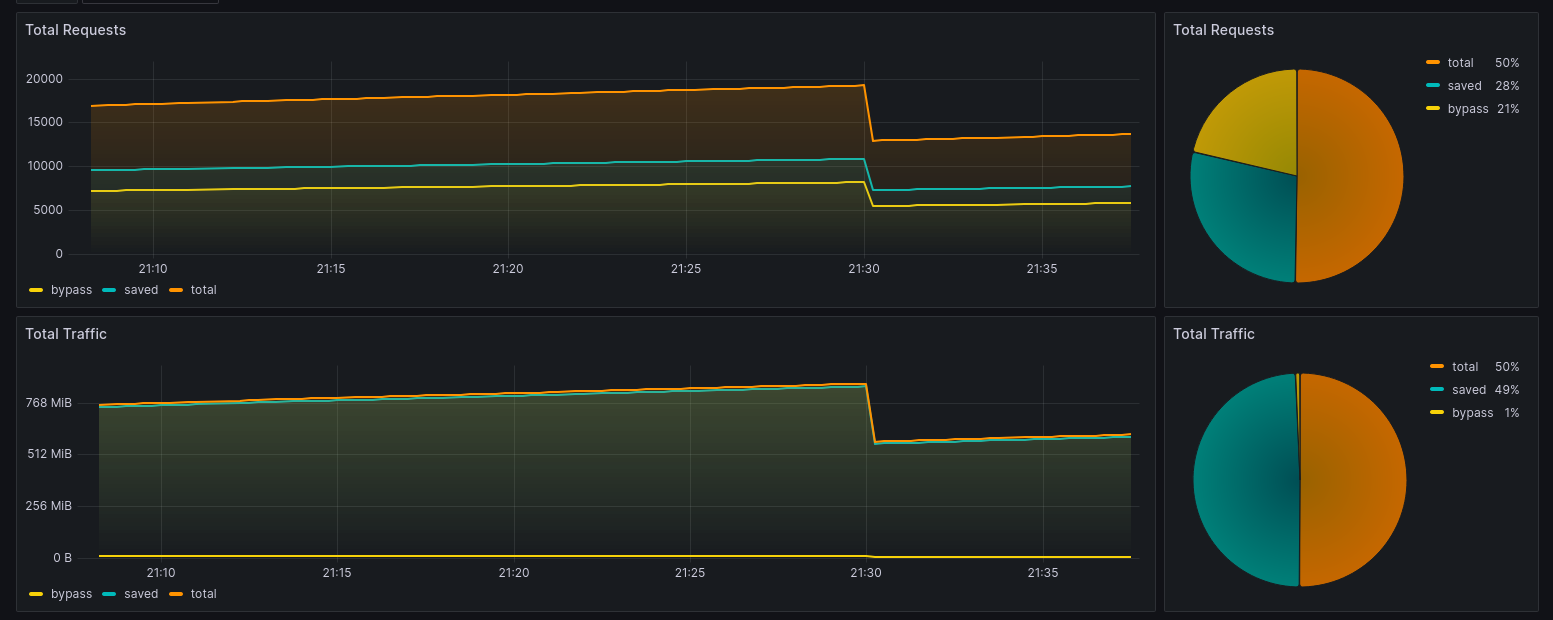
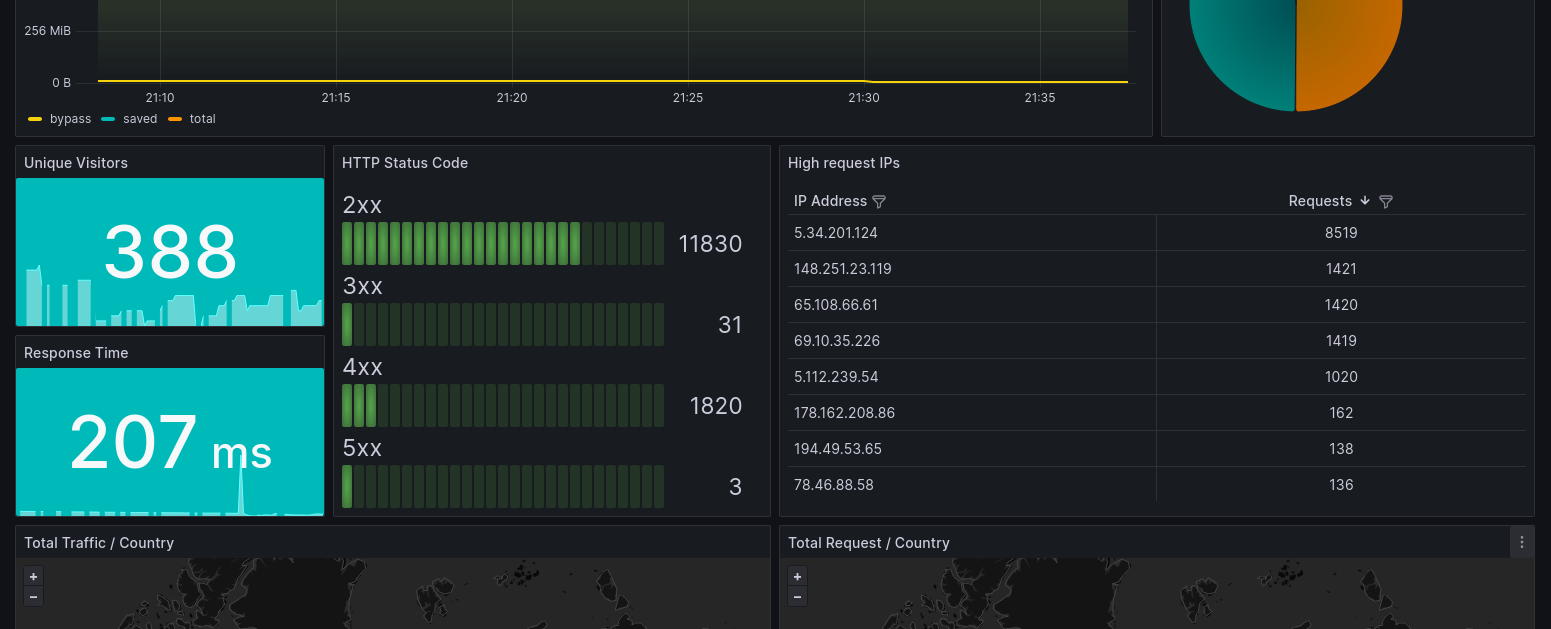
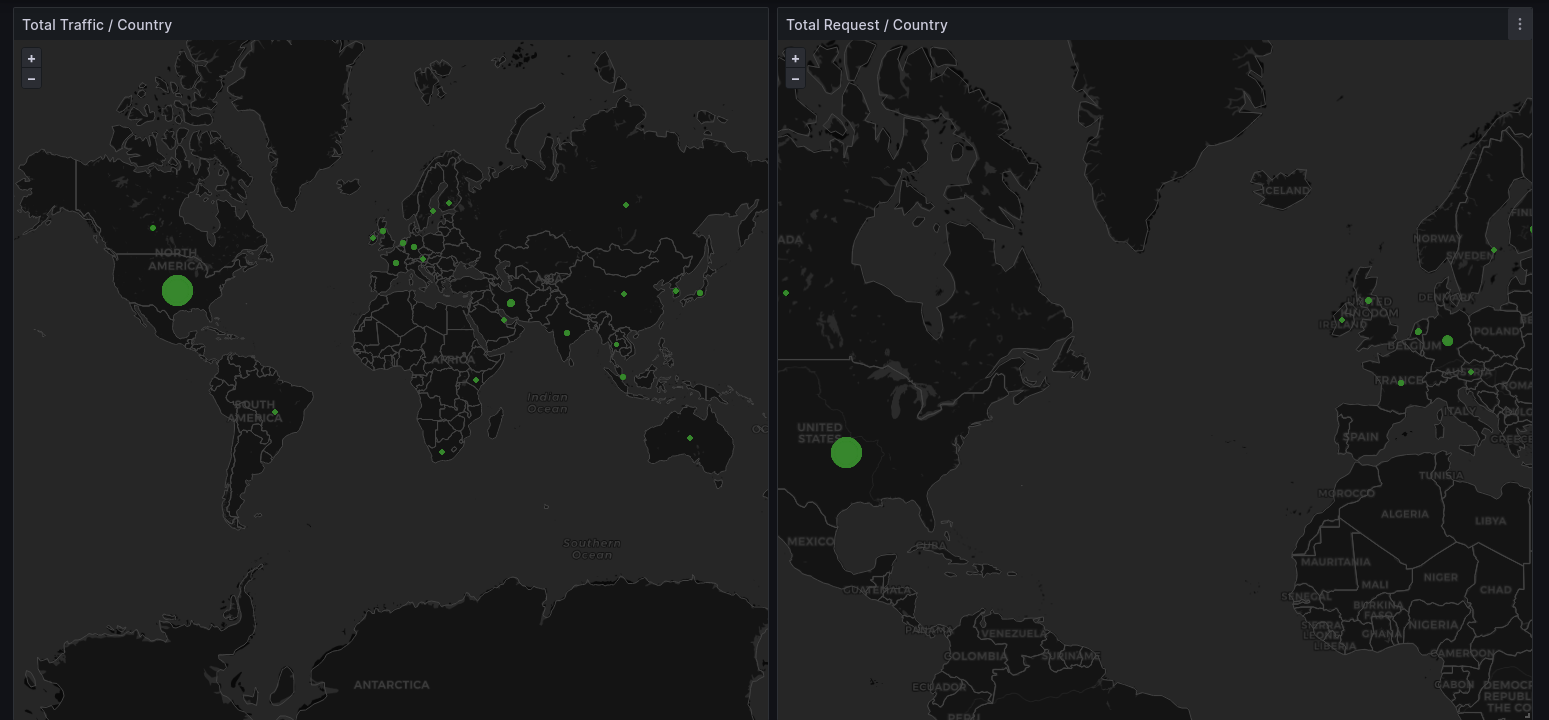
ArvanCloud CDN Dashboard
ArvanCloud Prometheus exporter

It's a Prometheus exporter that exposes metrics from ArvanCloud products. Currently, it supports the following products:
- CDN
- Object Storage
- PaaS/CaaS (coming soon)
- IaaS (coming soon)
How-to
You can run the exporter using Docker:
cp config/config.test.yml config/config.yml
docker run -d \
    -p 9786:9786 \
    -v ./config/config.yml:/app/config.yml \
    r1cloud/exporter:v1.1.0
Configuration
This document provides an overview of the configuration options available in the project YAML file (config.yml).
Token
The token field is used to specify the API key for authentication. It should be kept secure and not shared publicly. You can read more about API keys in the ArvanCloud API documentation.
Example:
token: "apikey 87db6d20-1234-abcd-efgh-3a419c8b7479"
Products
The products section contains configurations for different product modules within the project.
CDN
products:
    cdn:
        enable: true
        domains:
            - "example.ir"
            - "example.com"
        period: 3h
enable: Set the enable field to true to activate the CDN collector.domains: Specify the domains that should be included in report collection.period: Set the period field to specify the time interval for your reports. For example, if you set the period to3h, the exporter will collect the last 3 hours of data from the ArvanCloud API.
Metrics
The CDN collector exposes the following metrics:
| Name | Description | Type |
|---|---|---|
arvancloud_cdn_requests | Number of requests | gauge |
arvancloud_cdn_traffic | Traffic served by ArvanCloud per types | gauge |
arvancloud_cdn_visitors | Number of unique visitors | gauge |
arvancloud_cdn_high_request_ips | High request IPs | gauge |
arvancloud_cdn_requests_by_country | Number of request by country | gauge |
arvancloud_cdn_traffic_by_country | Traffic by country | gauge |
arvancloud_cdn_response_time | Response time | gauge |
arvancloud_cdn_requests_by_status | Number of request by HTTP status code | gauge |
❗️Warning: The high-request-ips metric is available in Professional plan and higher.
❕Note: All metrics will be labeled with domain label.
Dashboard
You can use pre-defined dashboard 20105 to visualize your data or create your own dashboard.

Contributing 🤝
We welcome contributions from the community. Please report any issues you find on the Issues page or send us an email at cdn@arvancloud.ir.
Object Storage
products:
    object:
        enable: true
        buckets:
            - "bucket1"
            - "bucket2"
enable: Set the enable field to true to activate the object storage collector.buckets: Specify the buckets that should be included in bucket usage metrics report collection.
Metrics
The object storage collector exposes the following metrics:
| Name | Description | Type |
|---|---|---|
arvancloud_storage_modified_time | Indicates the most recent update time of the bucket usage in UTC (if it's zero, it means there's no usage for today) | gauge |
arvancloud_storage_total_object_count | Represents the total count of objects in bucket | gauge |
arvancloud_storage_multi_part_object_count | Represents the total count of multipart objects | gauge |
arvancloud_storage_bucket_size | Represents the actual size of the bucket in bytes | gauge |
arvancloud_storage_bucket_download | Represents bucket downloads in bytes | gauge |
arvancloud_storage_bucket_upload | Represents bucket uploads in bytes | gauge |
arvancloud_storage_bucket_request_count | Represents the total count of successful operations per operation_type label | gauge |
❕Note: operation_type label in arvancloud_storage_bucket_request_count can be one of following types: put_object, get_object, delete_object, post_head & head_bucket.
❕Note: All metrics will be labeled with bucket label.
❕Note: Bucket usage data gets updated every 5 minutes.
Dashboard
You can use pre-defined dashboard 20106 to visualize your data or create your own dashboard.

Contributing 🤝
We welcome contributions from the community. Please report any issues you find on the Issues page or send us an email at object-storage@arvancloud.ir.
Data source config
Collector config:
Upload an updated version of an exported dashboard.json file from Grafana
| Revision | Description | Created | |
|---|---|---|---|
| Download |


