AdInsure Perf v27 Kubernetes
Monitoring information about AdInsure v27 environment
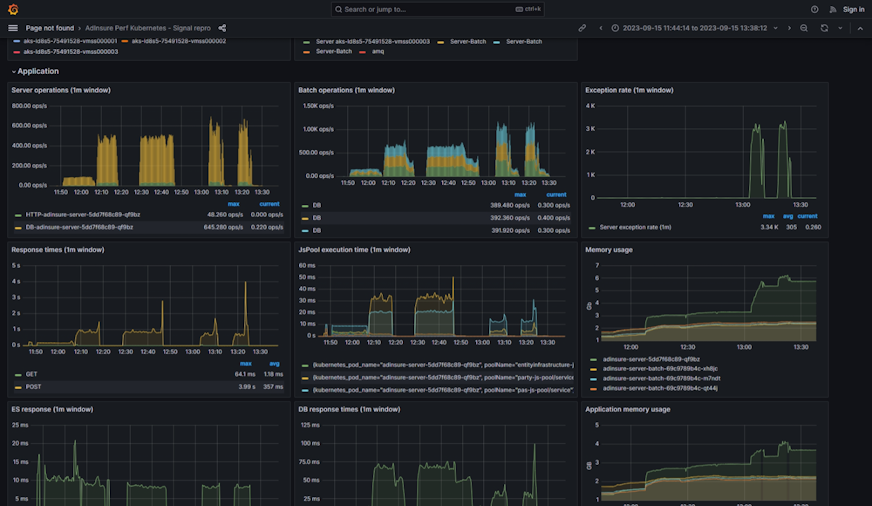
The AdInsure Perf v27 Kubernetes dashboard uses the grafana-azure-monitor-datasource and prometheus data sources to create a Grafana dashboard with the graph, heatmap, stat and timeseries panels.
Data source config
Collector type:
Collector plugins:
Collector config:
Revisions
Upload an updated version of an exported dashboard.json file from Grafana
| Revision | Description | Created | |
|---|---|---|---|
| Download |
Kubernetes
Monitor your Kubernetes deployment with prebuilt visualizations that allow you to drill down from a high-level cluster overview to pod-specific details in minutes.
Learn more