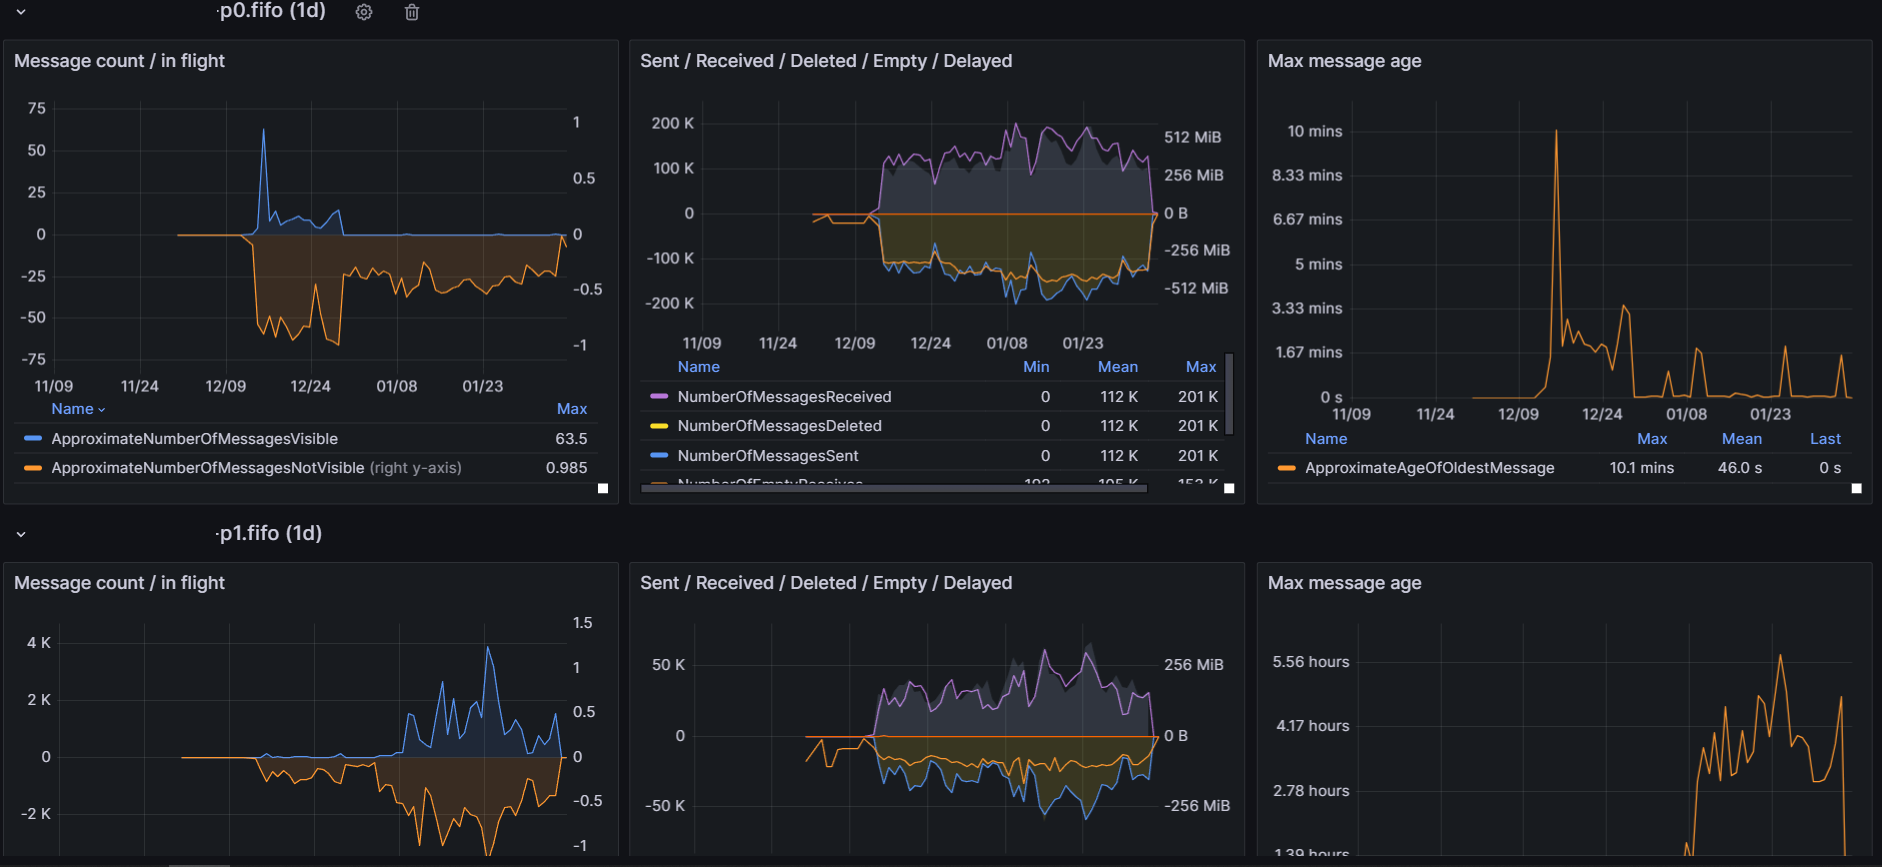
AWS SQS CloudWatch
This dashboard uses aws sqs namespace cloudwatch metrics. Multiple queues (deadletter and main queue) can be monitored at once.

AWS SQS
Github: https://github.com/cboudereau/grafana-dashboards/tree/main/aws/sqs
This dashboard uses aws sqs namespace cloudwatch metrics
Multiple queue monitoring

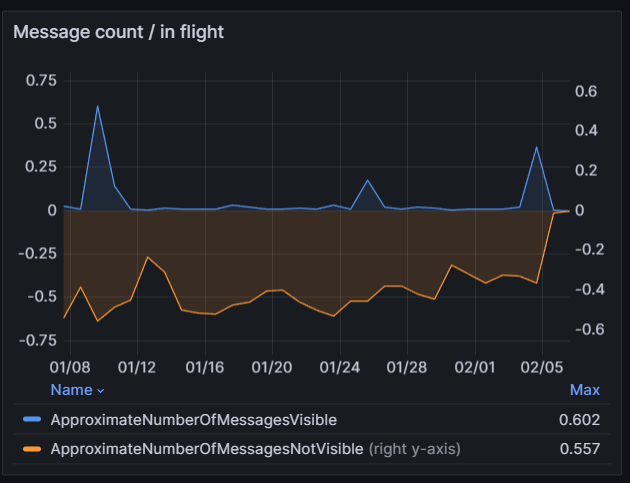
Message count / In Flight

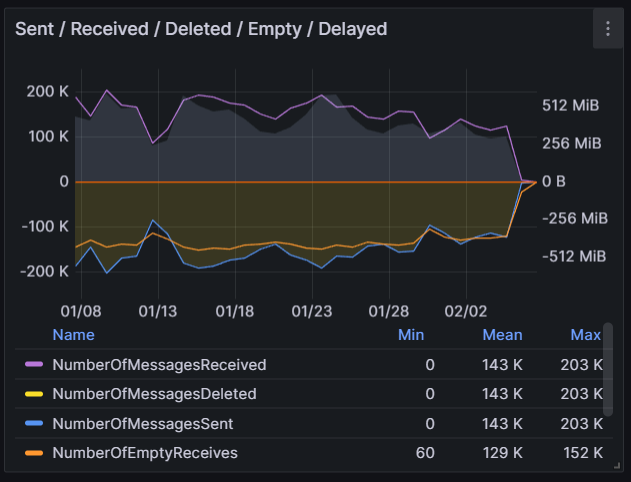
Message Sent / Received / Size
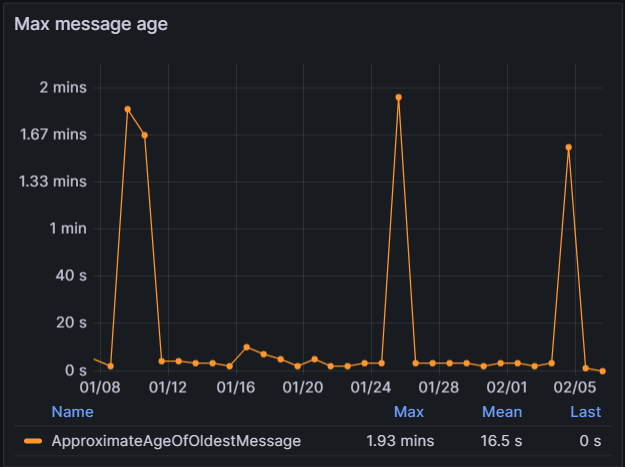
Max Message Age

Data source config
Collector type:
Collector plugins:
Collector config:
Revisions
Upload an updated version of an exported dashboard.json file from Grafana
| Revision | Description | Created | |
|---|---|---|---|
| Download |
AWS
Easily visualize and alert on more than 60 Amazon Web Services (AWS) resources using the fully managed Grafana Cloud platform.
Learn more