Telegraf metrics monitoring template
A public dashboard for Telegraf metrics monitoring using Grafana
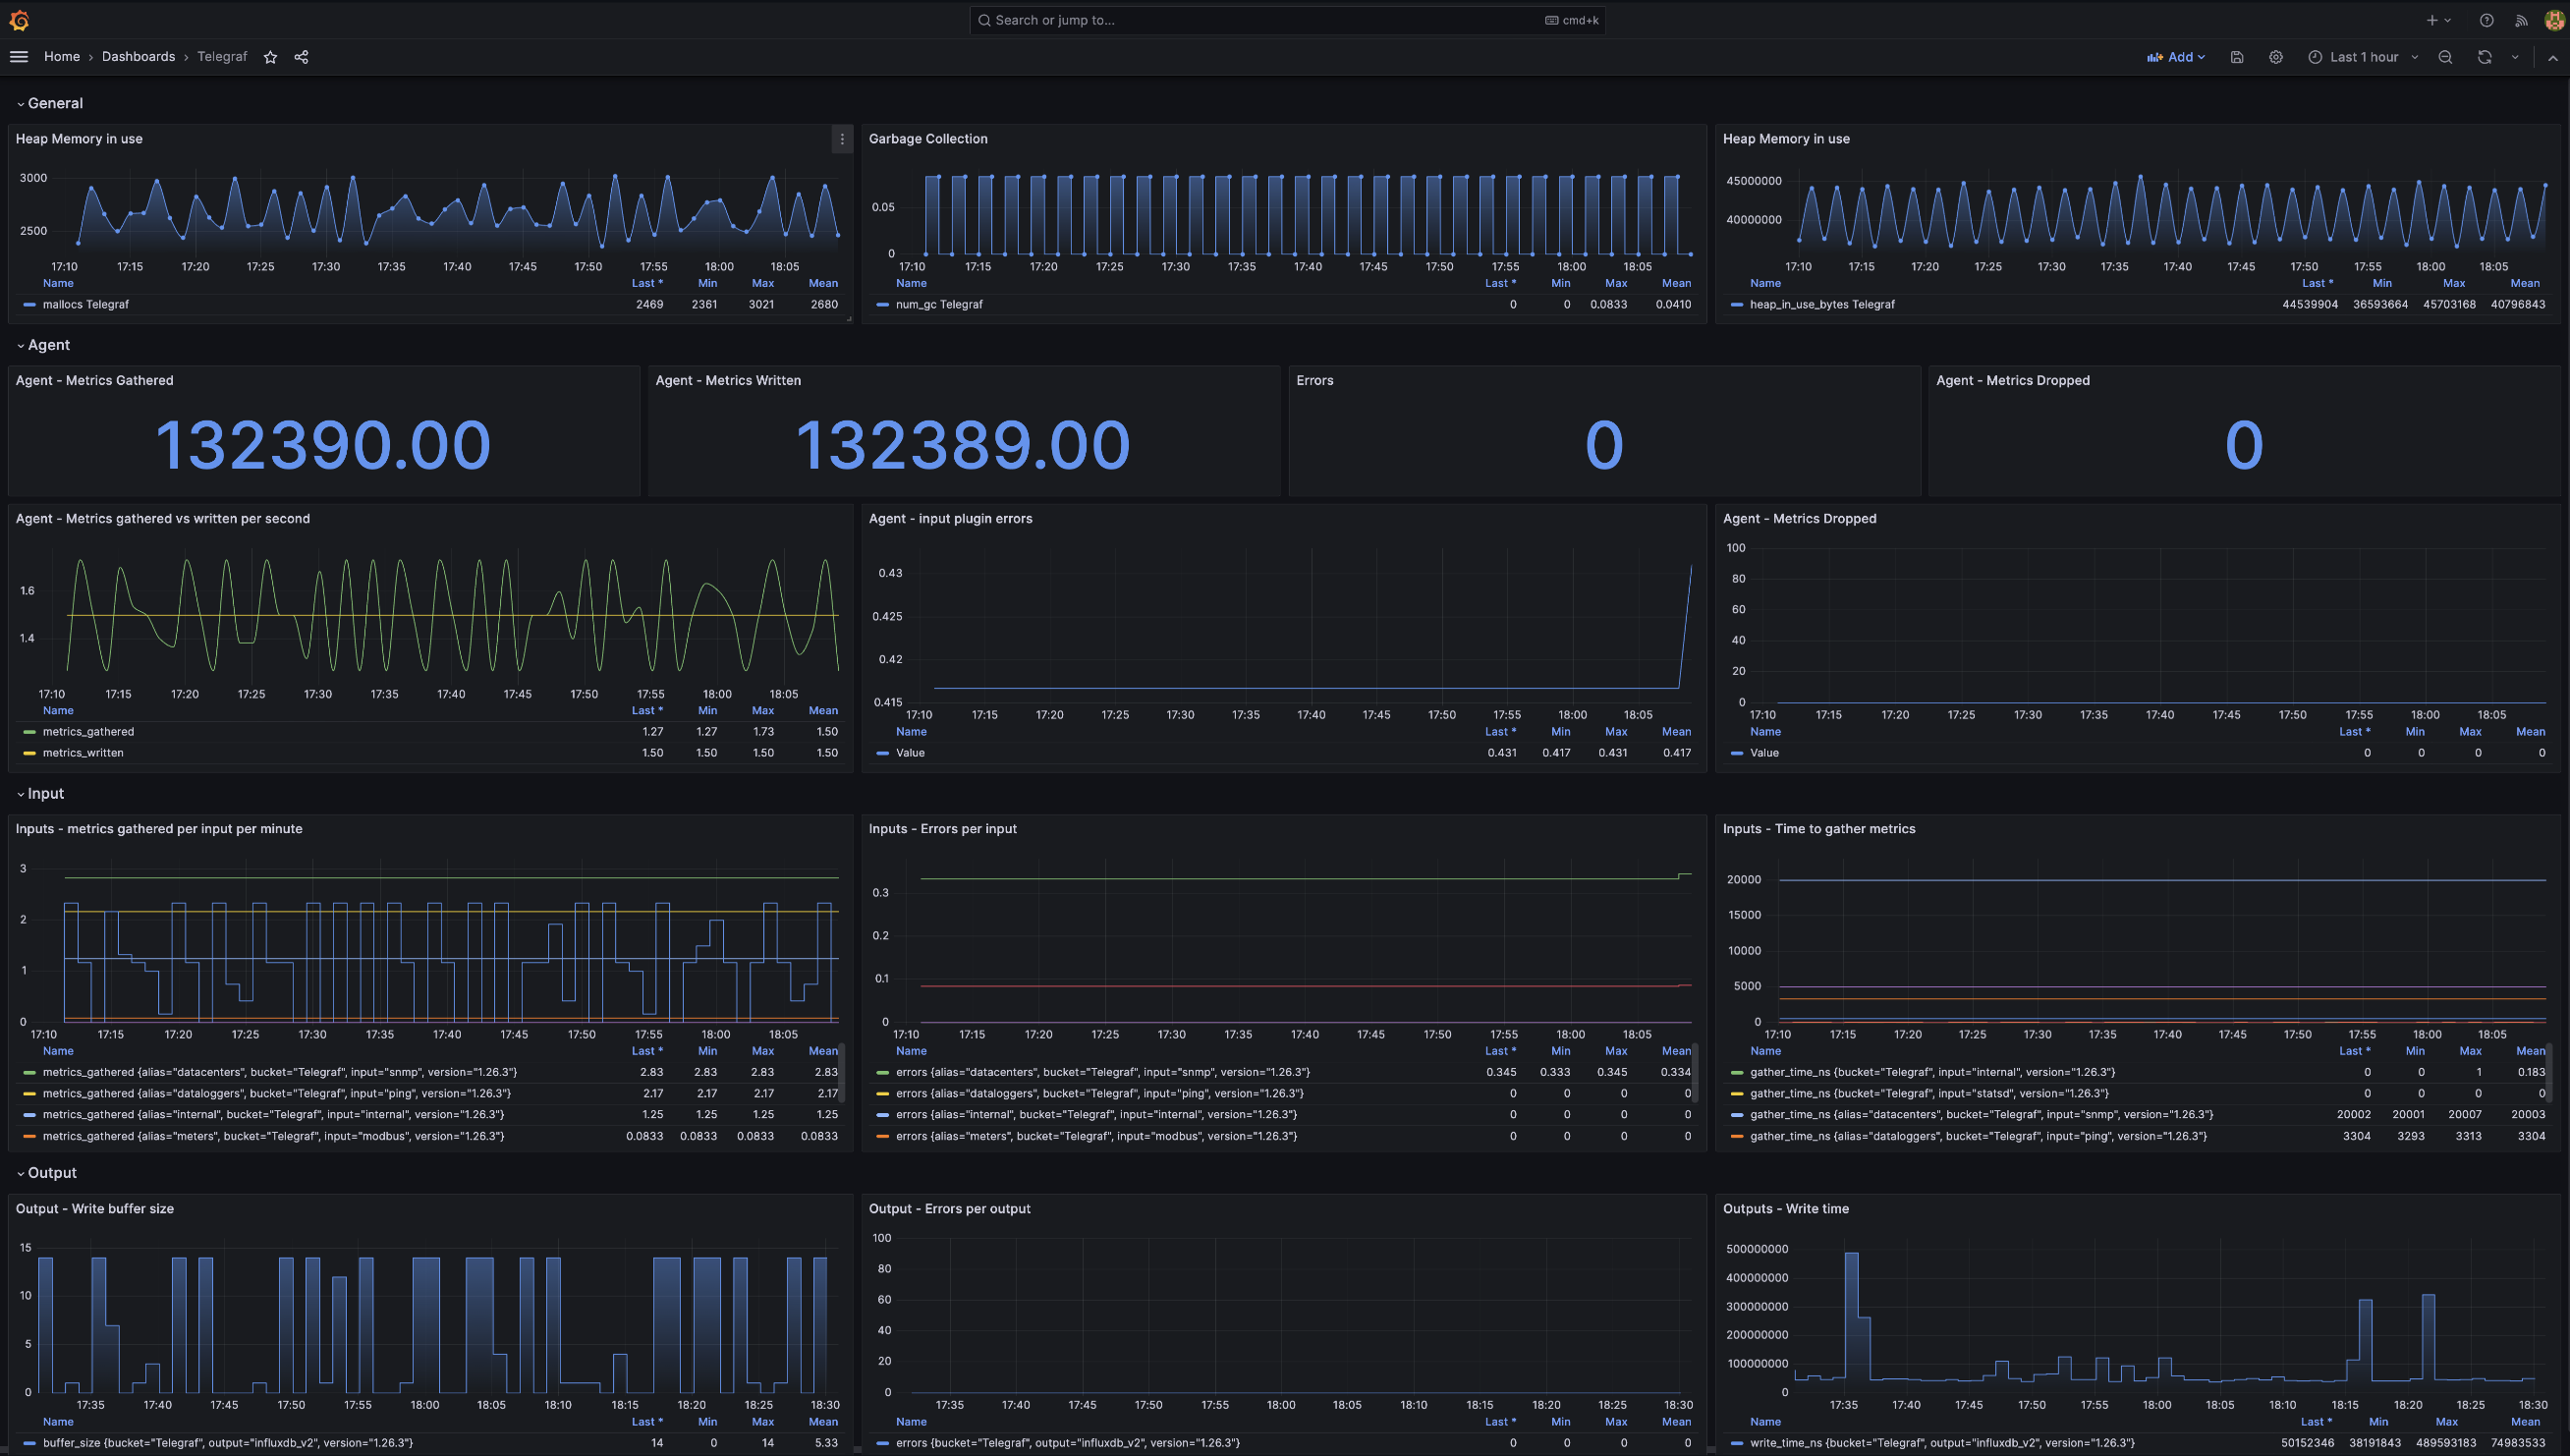
Telegraf Dashboard for Grafana
This is the Grafana version of the Telegraf metrics monitoring template for InfluxDB.
Prerequisites
This dashboard assumes that you already set up:
- An InfluxDB instance and its relative datasource in Grafana
- A bucket named
Telegrafwith 7 days retention - A Telegraf
configplugin for internal metrics collection and InfluxDB v2 output
Details about the setup instruction can be found here
Metrics collected
This dashboard allows to monitor the Telegraf agent, input plugins, set up alarms, identify errors in the metrics collection and so on. The following is a non exaustive list of the metrics collected from Telegraf internal metrics plugin.
- Number of metrics collected
- Metrics collected vs written per second
- Metrics gathered per input per minute
- Write buffer size
- Memory Allocations
- Metrics written
- Input plugin errors
- Errors per input
- Errors per output
- Garbage collection
References
Data source config
Collector type:
Collector plugins:
Collector config:
Revisions
Upload an updated version of an exported dashboard.json file from Grafana
| Revision | Description | Created | |
|---|---|---|---|
| Download |