PaloAlto PanOS Firewall
Dashboard for PaloAlto Firewalls
Monitor Palo Alto Firewalls
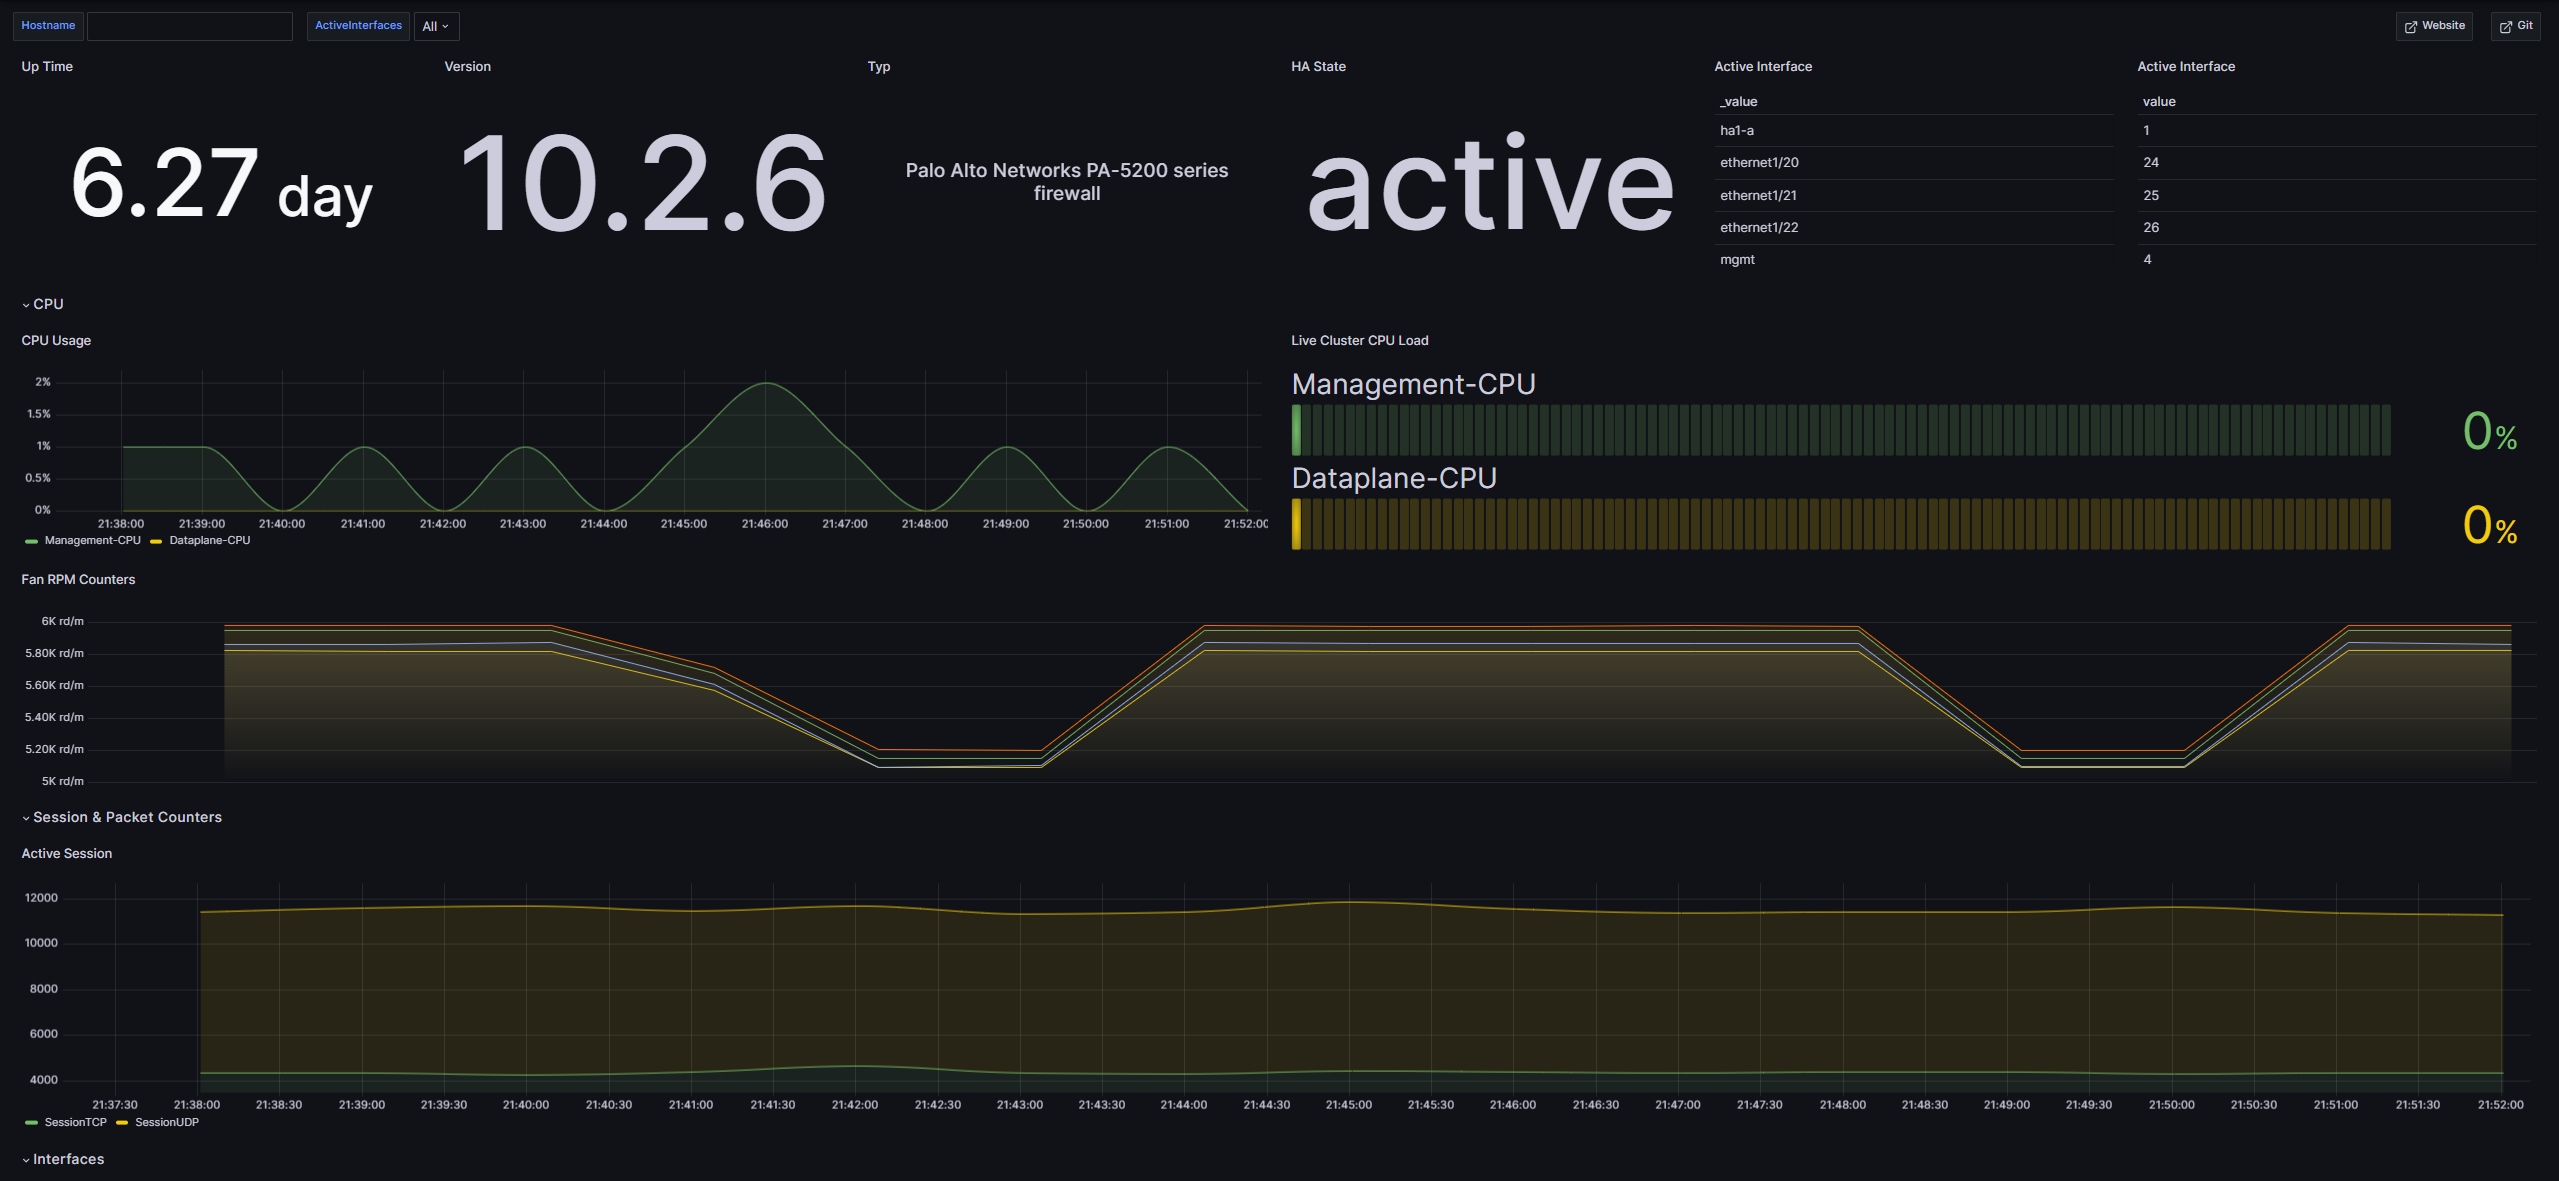
With this dashboard you can mointor your Palo Alto firewalls. You can get an Overview for the following metrics:
- Up Time (since when is the system running)
- Version (which verison is installed on the firewall)
- Typ (which typ of firewall is it)
- HA State (is high availability acitv on the firewall)
- Active Interface (which ports are activ and which interface is on them)
- CPU Usage (how much of the CPU is used in pervent)
- Fan RPM Counters (are the fans running)
- CPU Temperature (the temperature of the CPU)
- Active Session (see how many TCP and UDP Sessions are active)
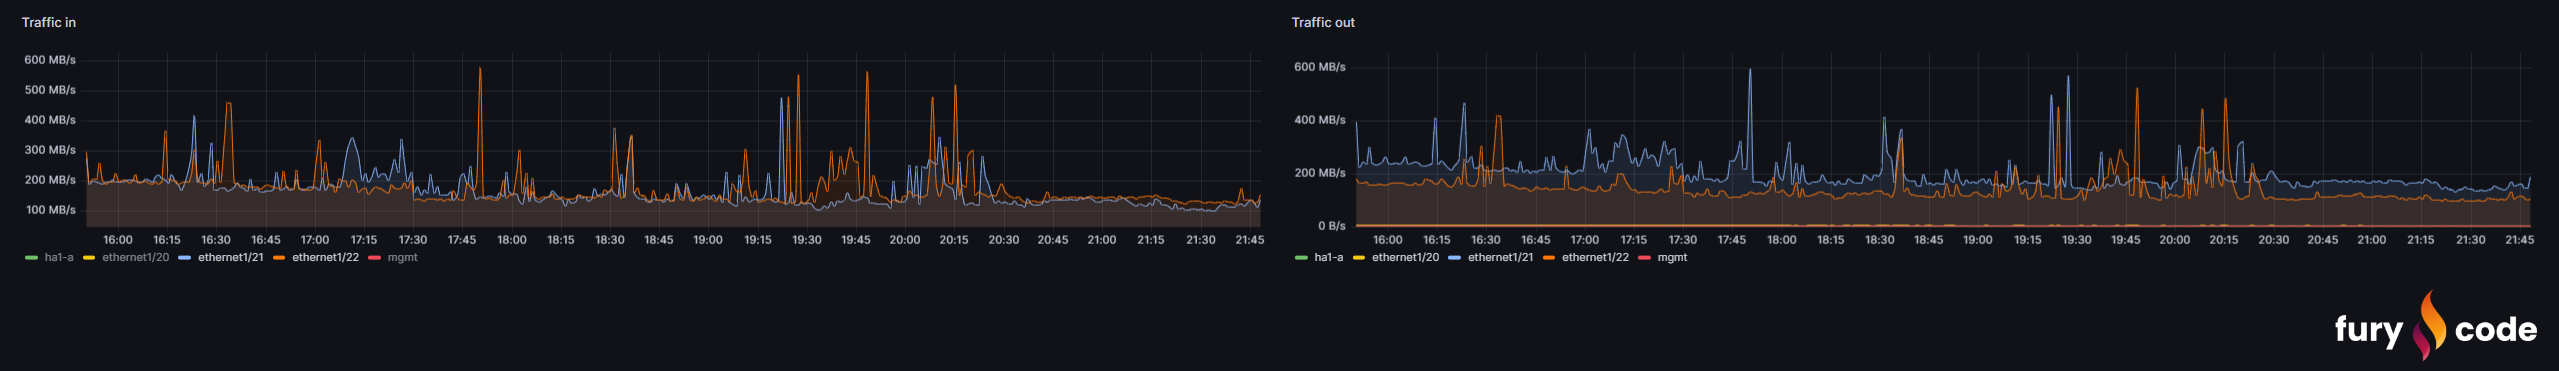
- Traffic in (see the Traffic in)
- Traffic out (see the Traffic out)
The Dashboard automatically detects up to 30 ports, which of those are activ and starts to monitor them. If you have more then 30 ports on your firewall, you have to add them in the collector.
The collector and dashboard were tested on Palo Alto Firewalls 5200 and 220.
You can find more information here: GitHub
Data source config
Collector type:
Collector plugins:
Collector config:
Revisions
Upload an updated version of an exported dashboard.json file from Grafana
| Revision | Description | Created | |
|---|---|---|---|
| Download |