TDsmeters
TDengine DBMark dmeters database show data
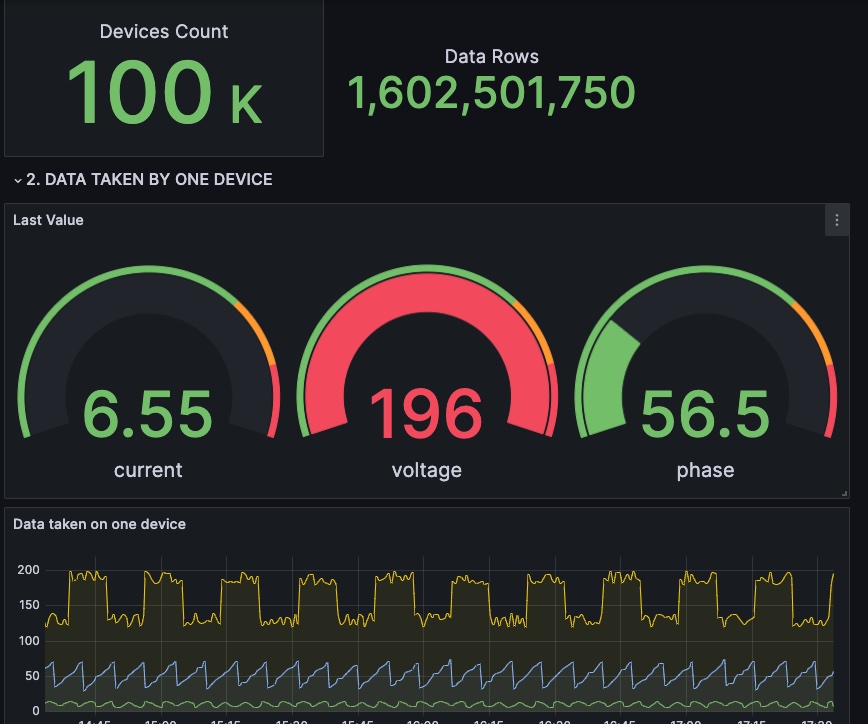
The TDsmeters plugin is a real-time display plugin for the dynamic collection process of smart meter data in TDengine Cloud as a Service DBMark. Installation and use are very simple, divided into two steps:
I. Establish a data source connection
- Open the locally installed grafana page and select add new connection from the main menu.
- Enter "TDengine Datasource" in the search box, and the "TDengine DataSource" connection plugin will appear
- Click the plugin, enter the plugin installation page, then click Install (ignore this step if the plugin is already installed)
- Return to the main menu and click "Data Sources" menu, and click the "add new data source" button in the upper right corner of the page.
- Search box appears, enter "TDengine DataSource", click this plugin
- Enter the plugin data source configuration page, how to fill according to https://cloud.tdengine.com/ helping document is tools - > grafana plugin - > Add Data Source
- After the configuration is completed, click the "save & test" button, and the test connection is correct.
- Open https://cloud.tdengine.com/ , go to the DBMark page, and open "the real-time collection of smart meters" shared library
II. Install the TDsmeters plugin
- Open the grafana main page and select Dashborads from the main menu.
- After opening the Dashborads page, click the "new" button in the upper right corner and select "import".
- Fill the ID: 19910 in the textbox that tips whith text "Dashborad URL or ID", and click the load button on the right to load it.
- Continuously fill the plugin name you want to name and select the data source established in the above step in Select Data Source.
- After filling in the above, click the "import" button
- In this way, the plugin page is displayed in front of you.
Data source config
Collector type:
Collector plugins:
Collector config:
Revisions
Upload an updated version of an exported dashboard.json file from Grafana
| Revision | Description | Created | |
|---|---|---|---|
| Download |
