ahoyDTU

grafana-ahoydtu
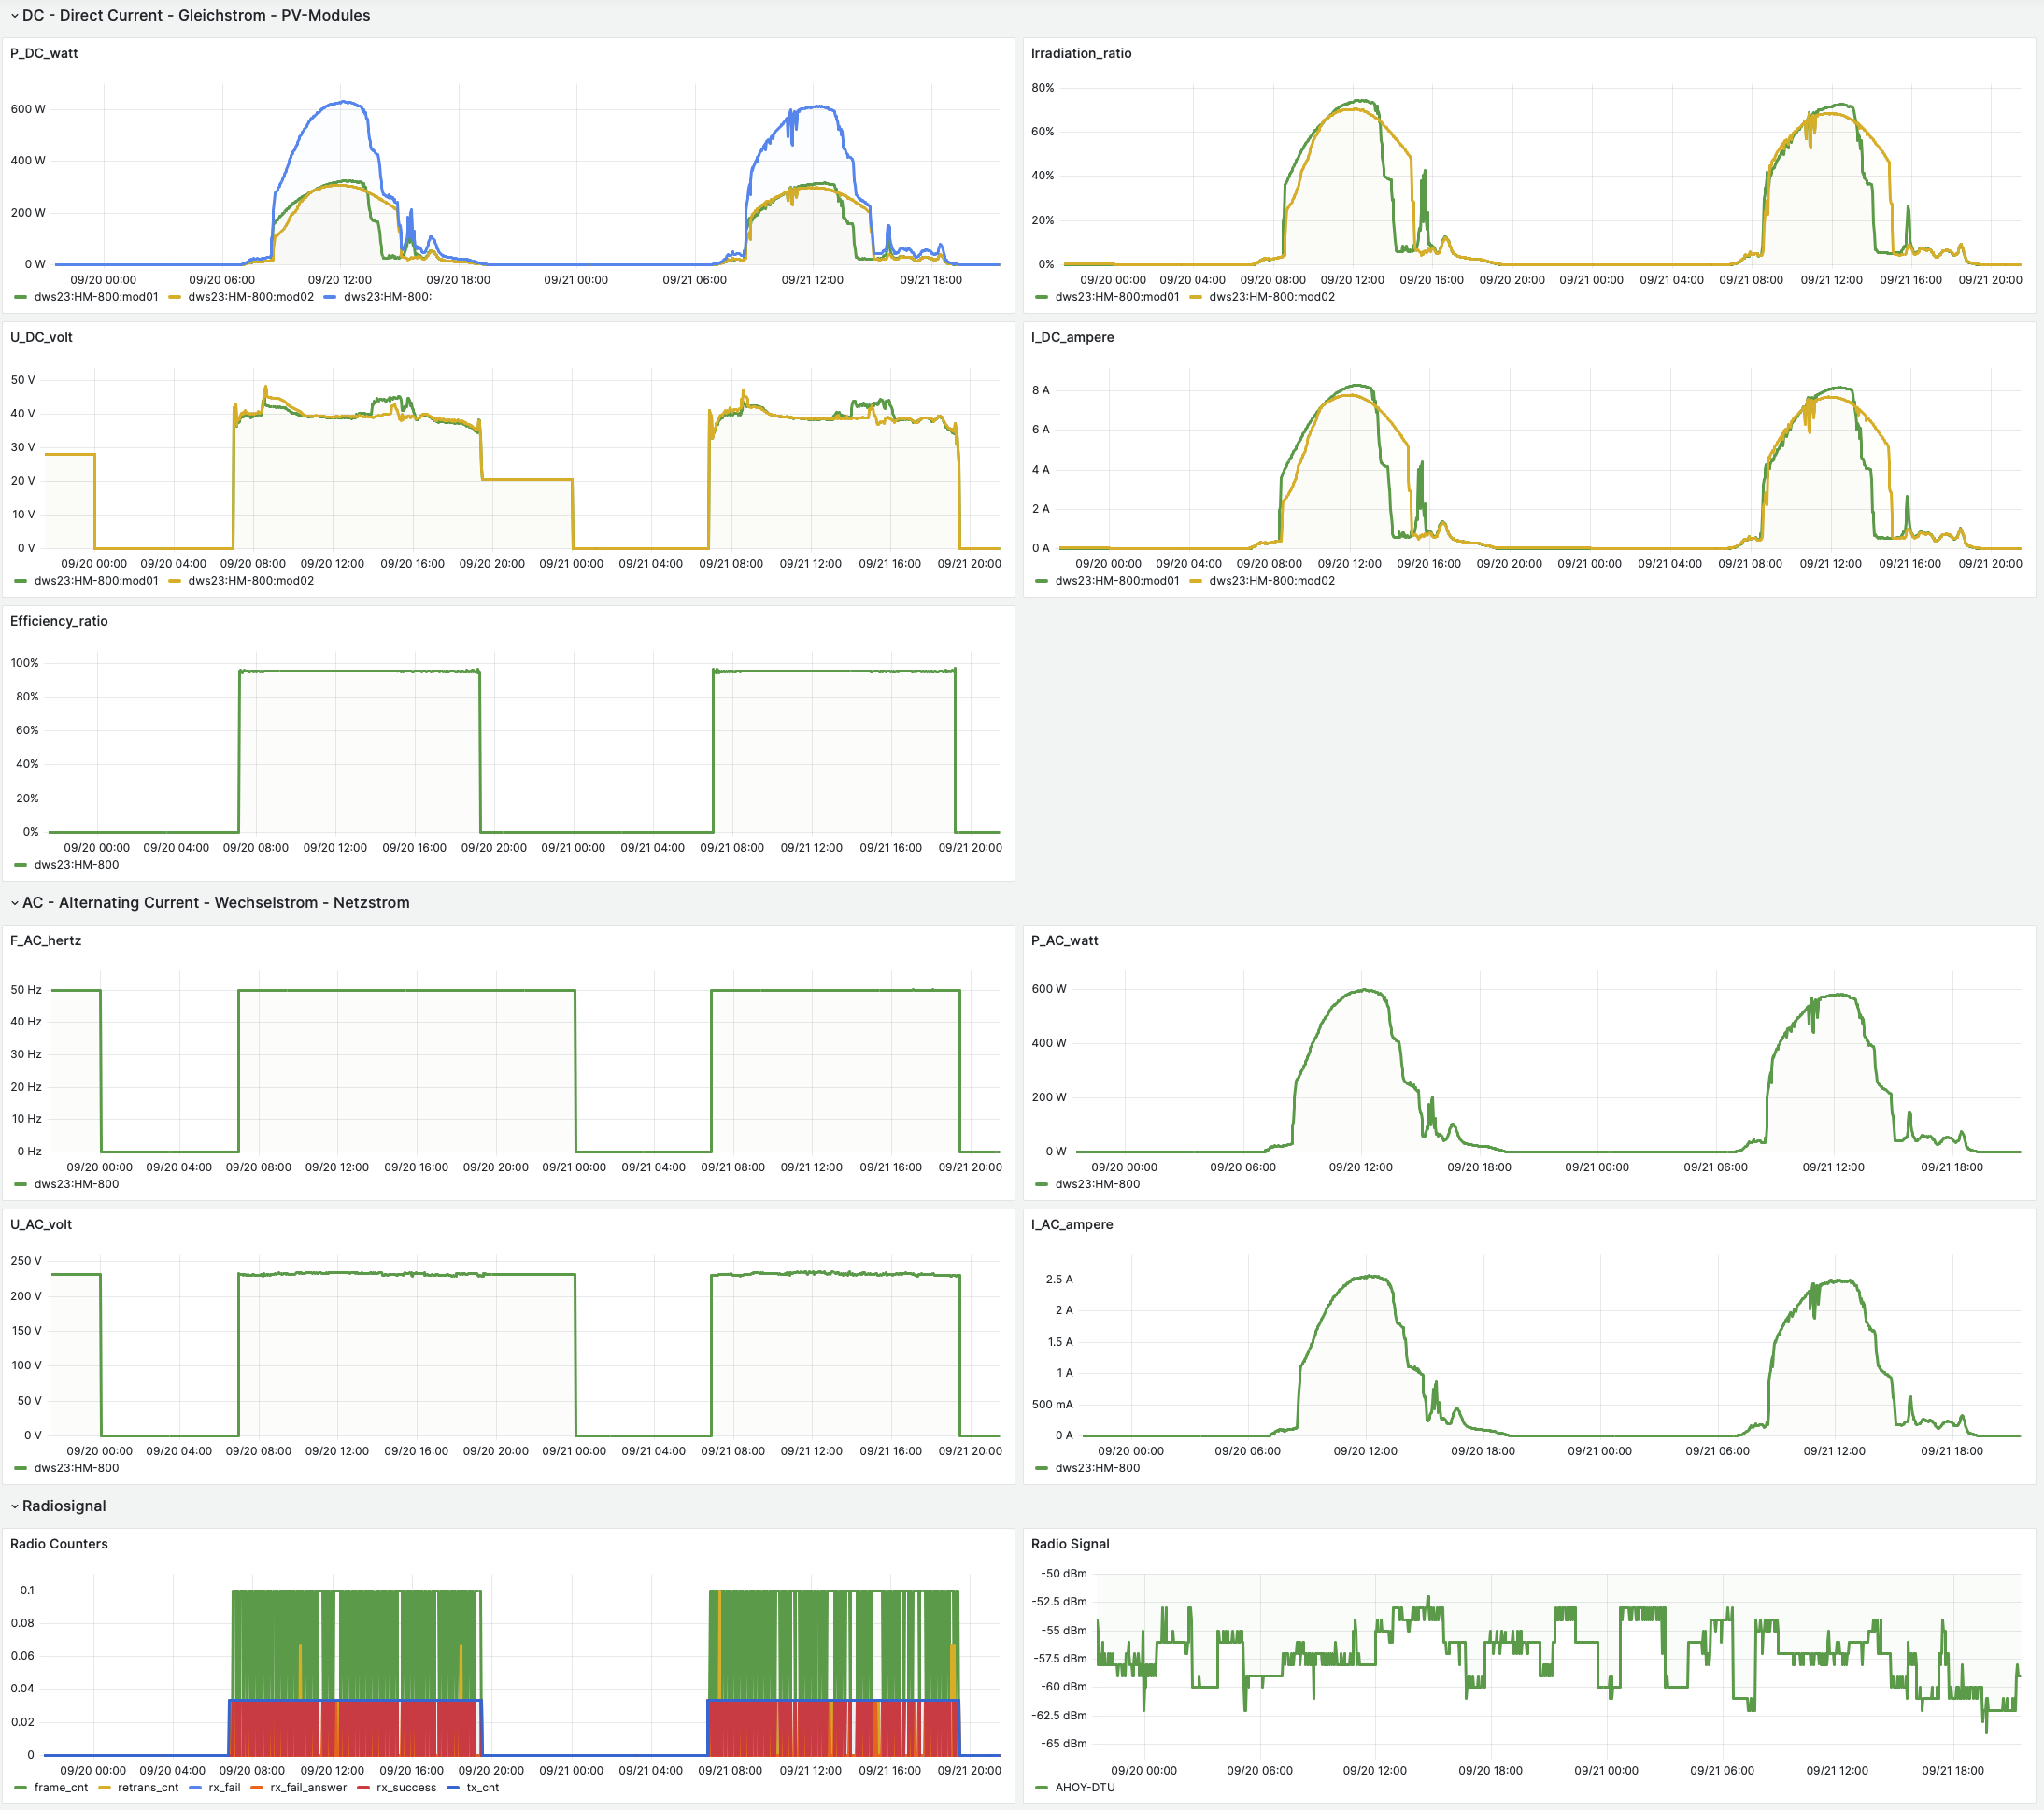
Grafana dashboard to use with ahoDTU's Prometheus endpoint
- ahoyDTU (https://ahoydtu.de, tested and working with >= v0.8.42)
- prometheus-enabled build (can be found here: https://github.com/lumapu/ahoy/releases in latest zip file, e.g. xxxxxx_ahoy_0.8.42_yyyyyy_esp32_prometheus.bin)
- running prometheus as data source
- obviously visualized in Grafana (tested and running on v10.2.3)
example prometheus job:
  - job_name: 'ahoydtu'
    scrape_interval: 30s
    static_configs:
      - targets:
        - 192.168.23.42			# assuming that's the IP of ahoyDTU
        labels:
          site: garage			# to identify different locations
Data source config
Collector type:
Collector plugins:
Collector config:
Revisions
Upload an updated version of an exported dashboard.json file from Grafana
| Revision | Description | Created | |
|---|---|---|---|
| Download |