VM & Kubernetes node monitoring powered by KaenIDC TAM
Monitoring all Public Cloud Provider's resources(Virtual Machine, Kubernetes Node) managed by KaenIDC TAM
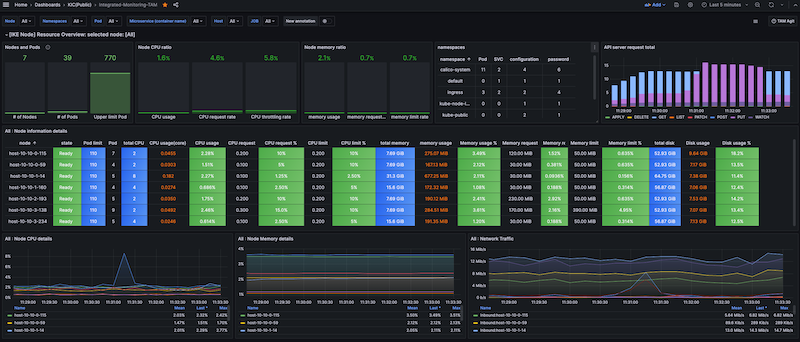
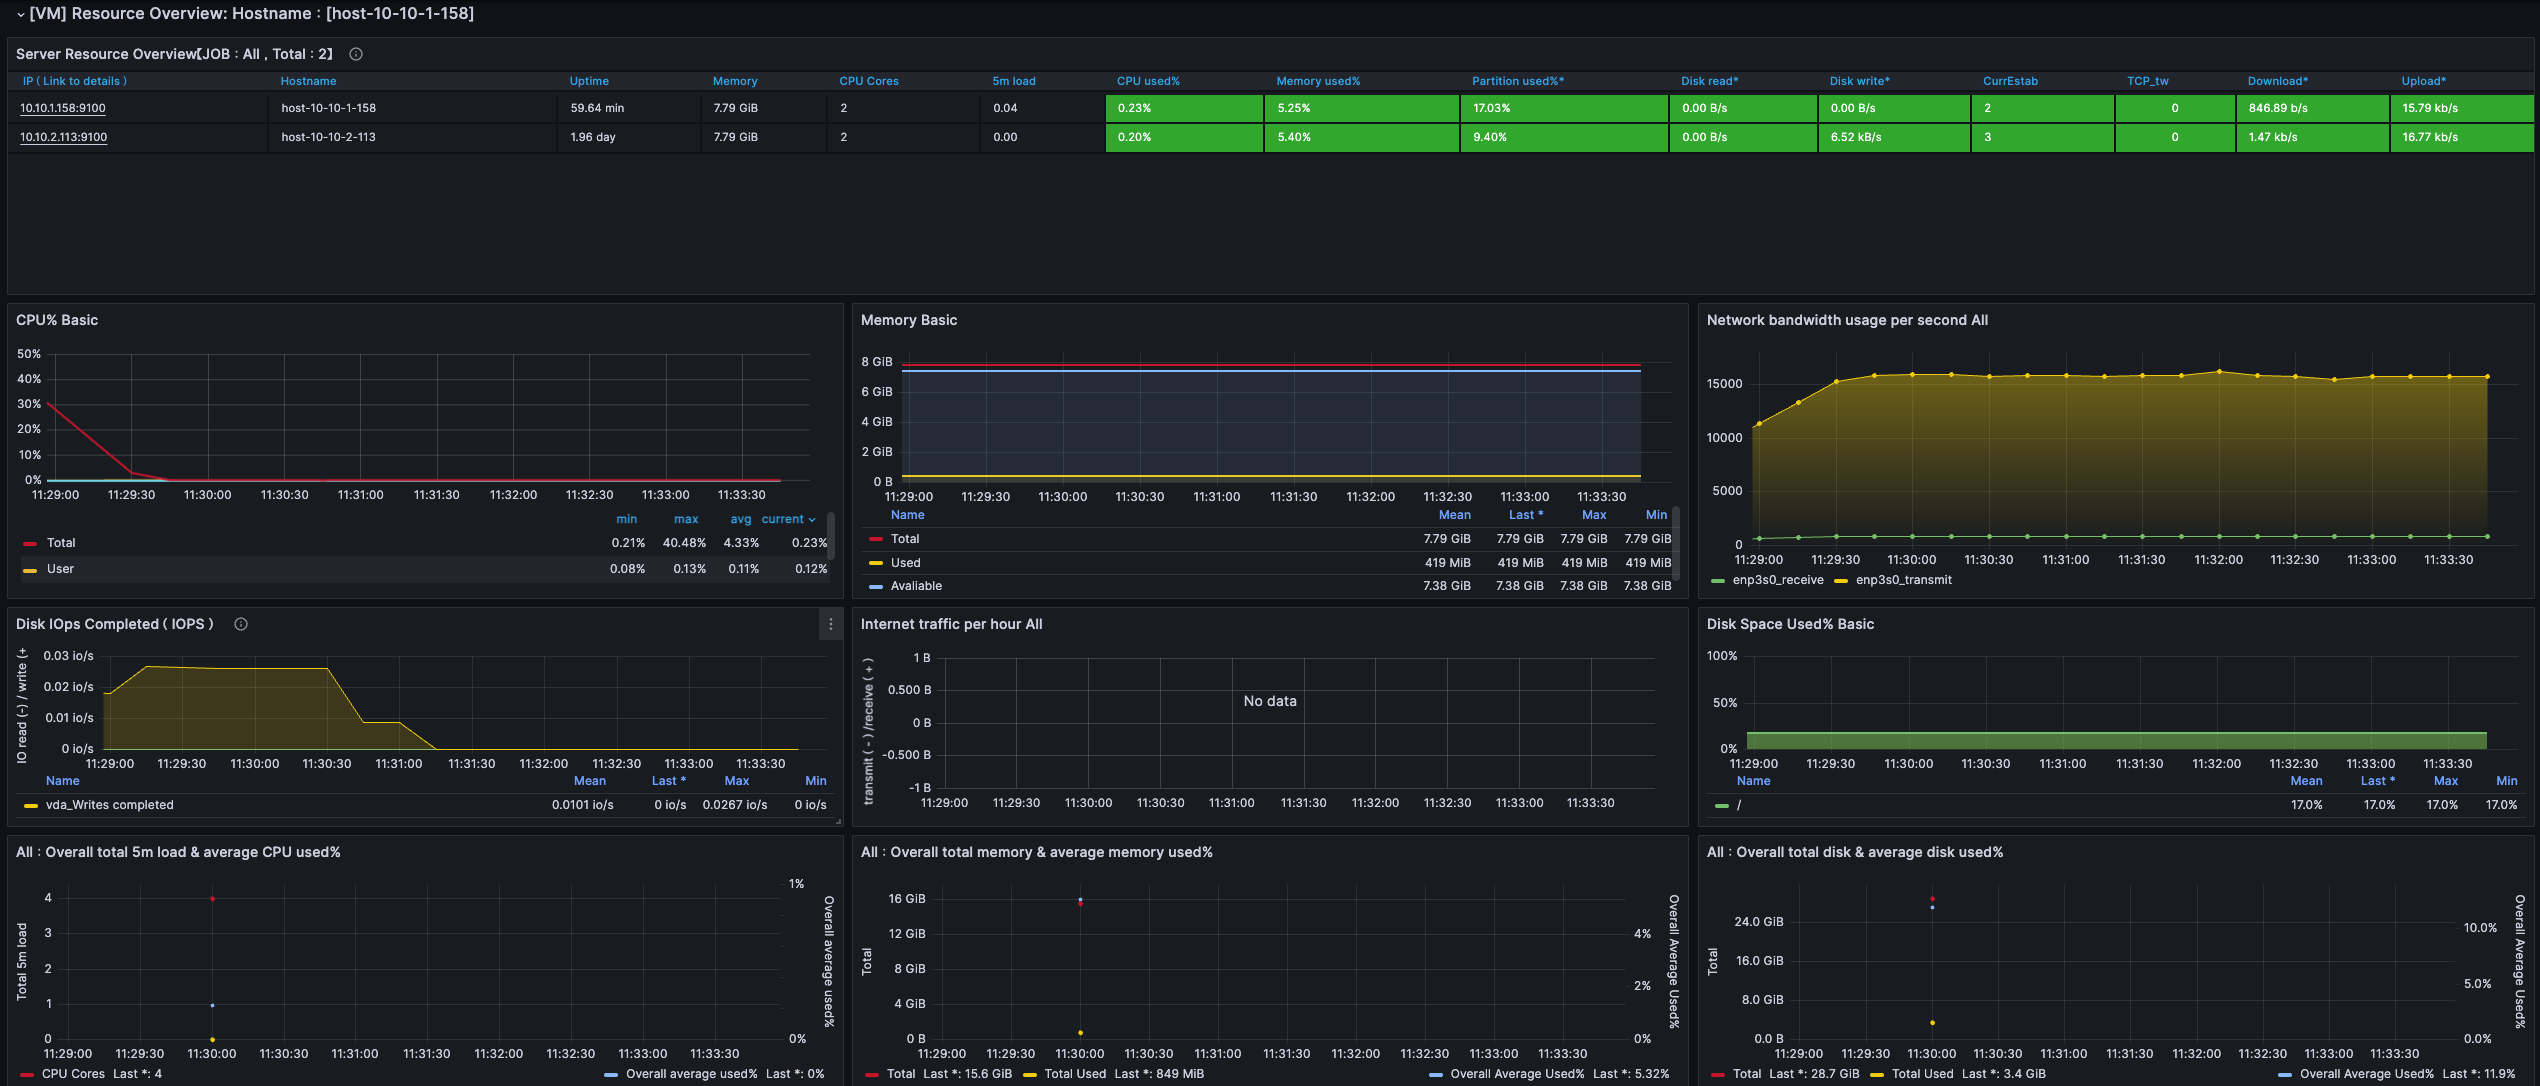
The VM & Kubernetes node monitoring powered by KaenIDC TAM dashboard uses the prometheus data source to create a Grafana dashboard with the bargauge, graph, table, table-old and timeseries panels.
Data source config
Collector type:
Collector plugins:
Collector config:
Revisions
Upload an updated version of an exported dashboard.json file from Grafana
| Revision | Description | Created | |
|---|---|---|---|
| Download |
Kubernetes
Monitor your Kubernetes deployment with prebuilt visualizations that allow you to drill down from a high-level cluster overview to pod-specific details in minutes.
Learn more