NAS
Getting Data into Grafana
- On NAS Host
- Following exporters can be installed on truenas scale host:
- prometheus-libvirt-exporter (Default port 9177)
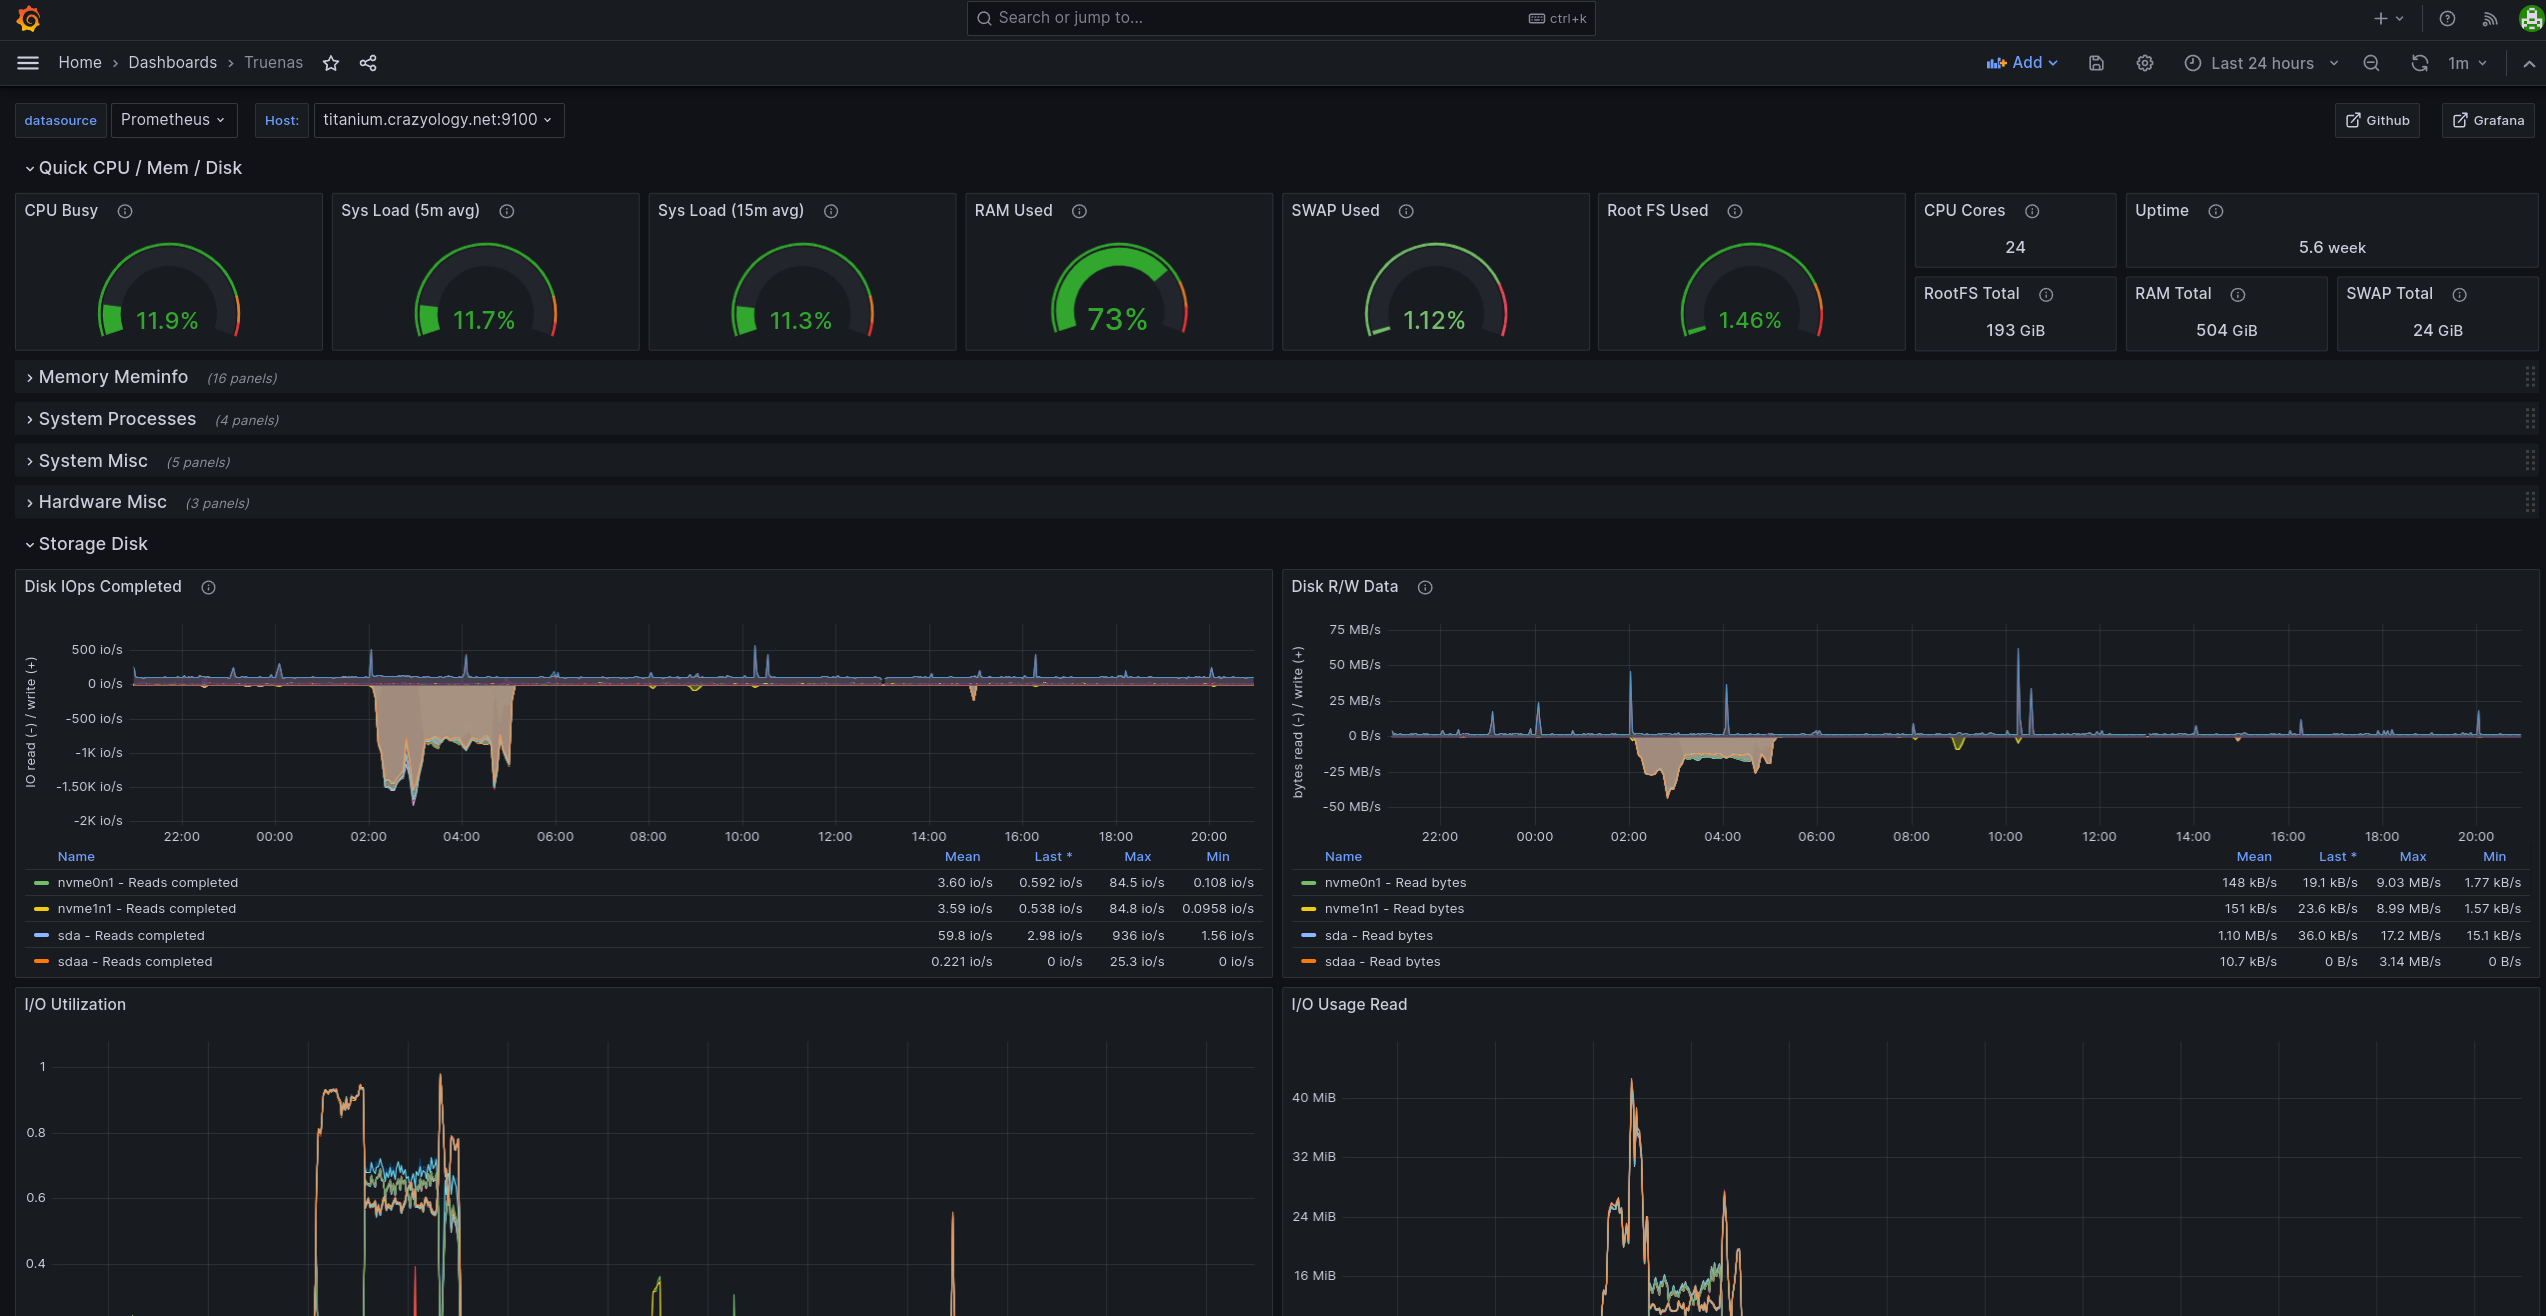
- prometheus-node-exporter (Default port 9100)
- prometheus-node-exporter-collectors
- prometheus-ipmi-exporter (Default Port: 9290)
- Disable default filesystem metrics from node-exporter by editing /etc/default/prometheus-node-exporter
ARGS="--no-collector.filesystem" - add Zfs Zpool script to /usr/share/prometheus-node-exporter-collectors and make it executable
- Create systemd files for data collections
- /lib/systemd/system/prometheus-node-exporter-zfs.service
[Unit] Description=Collect ZFS Zpool metrics for prometheus-node-exporter[Service] Type=oneshot Environment=TMPDIR=/var/lib/prometheus/node-exporter ExecStart=/bin/bash -c "/usr/share/prometheus-node-exporter-collectors/zfs_zpool.sh | sponge /var/lib/prometheus/node-exporter/zfs_zpool.prom"
- /lib/systemd/system/prometheus-node-exporter-zfs.timer
Configure IPMI[Unit] Description=Run ZFS metrics collection every 15 minutes ConditionPathExists=/usr/sbin/zfs ConditionPathExists=/usr/sbin/zpool[Timer] OnBootSec=0 OnUnitActiveSec=15min
[Install] WantedBy=timers.target
modules:
  default:
    collectors:
      - bmc
      - ipmi
      - dcmi
      - chassis
      - sel
      - sel-events
    exclude_sensor_ids:
      - 2
      - 29
      - 32
    sel_events:
      - name: correctable_memory_error
        regex: Correctable memory error.*
    collector_cmd:
      ipmi: /usr/bin/sudo
      sel: /usr/bin/sudo
      bmc: /usr/bin/sudo
      chassis: /usr/bin/sudo
      dcmi: /usr/bin/sudo
      sel-events: /usr/bin/sudo
    custom_args:
      ipmi:
      - "/usr/sbin/ipmimonitoring"
      sel:
      - "/usr/sbin/ipmi-sel"
      bmc:
      - "/usr/sbin/bmc-info"
      dcmi:
      - "/usr/sbin/ipmi-dcmi"
      chassis:
      - "/usr/sbin/ipmi-chassis"
      sel-events:
      - "/usr/sbin/ipmi-sel"
- /lib/systemd/system/prometheus-node-exporter-zfs.service
- Following exporters can be installed on truenas scale host:
- On the Prometheus Node:
- Add Scrape Config to Prometheus
      - job_name: truenas
        static_configs:
        - targets:
            - <NAS IP/fqdn>:9100 (Node Exporter)
            - <NAS IP/fqdn>:9177 (LIbvirt if using libvirt)
            - <NAS IP/fqdn>:9290 (IPMI if available)
Data source config
Collector type:
Collector plugins:
Collector config:
Revisions
Upload an updated version of an exported dashboard.json file from Grafana
| Revision | Description | Created | |
|---|---|---|---|
| Download |