Logs by Namespace
Using loki to get top 10 logs generated by pod in namespaces
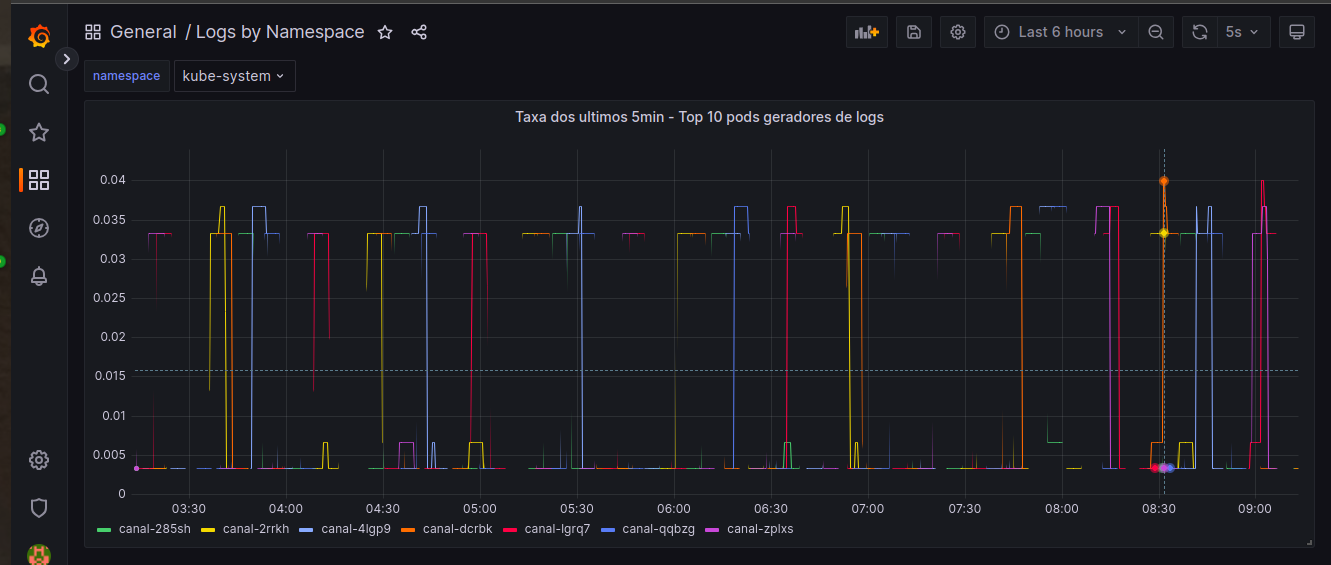
The Logs by Namespace dashboard uses the loki data source to create a Grafana dashboard with the timeseries panel.
Data source config
Collector type:
Collector plugins:
Collector config:
Revisions
Upload an updated version of an exported dashboard.json file from Grafana
| Revision | Description | Created | |
|---|---|---|---|
| Download |
Grafana Loki (self-hosted)
Easily monitor Grafana Loki (self-hosted), a horizontally scalable, highly available, multi-tenant log aggregation system inspired by Prometheus, with Grafana Cloud's out-of-the-box monitoring solution.
Learn more