devtron-app-throughput
Graph shows http status like 4xx, 5xx, 200, Throughput on Devtron dashboard. https://www.devtron.ai
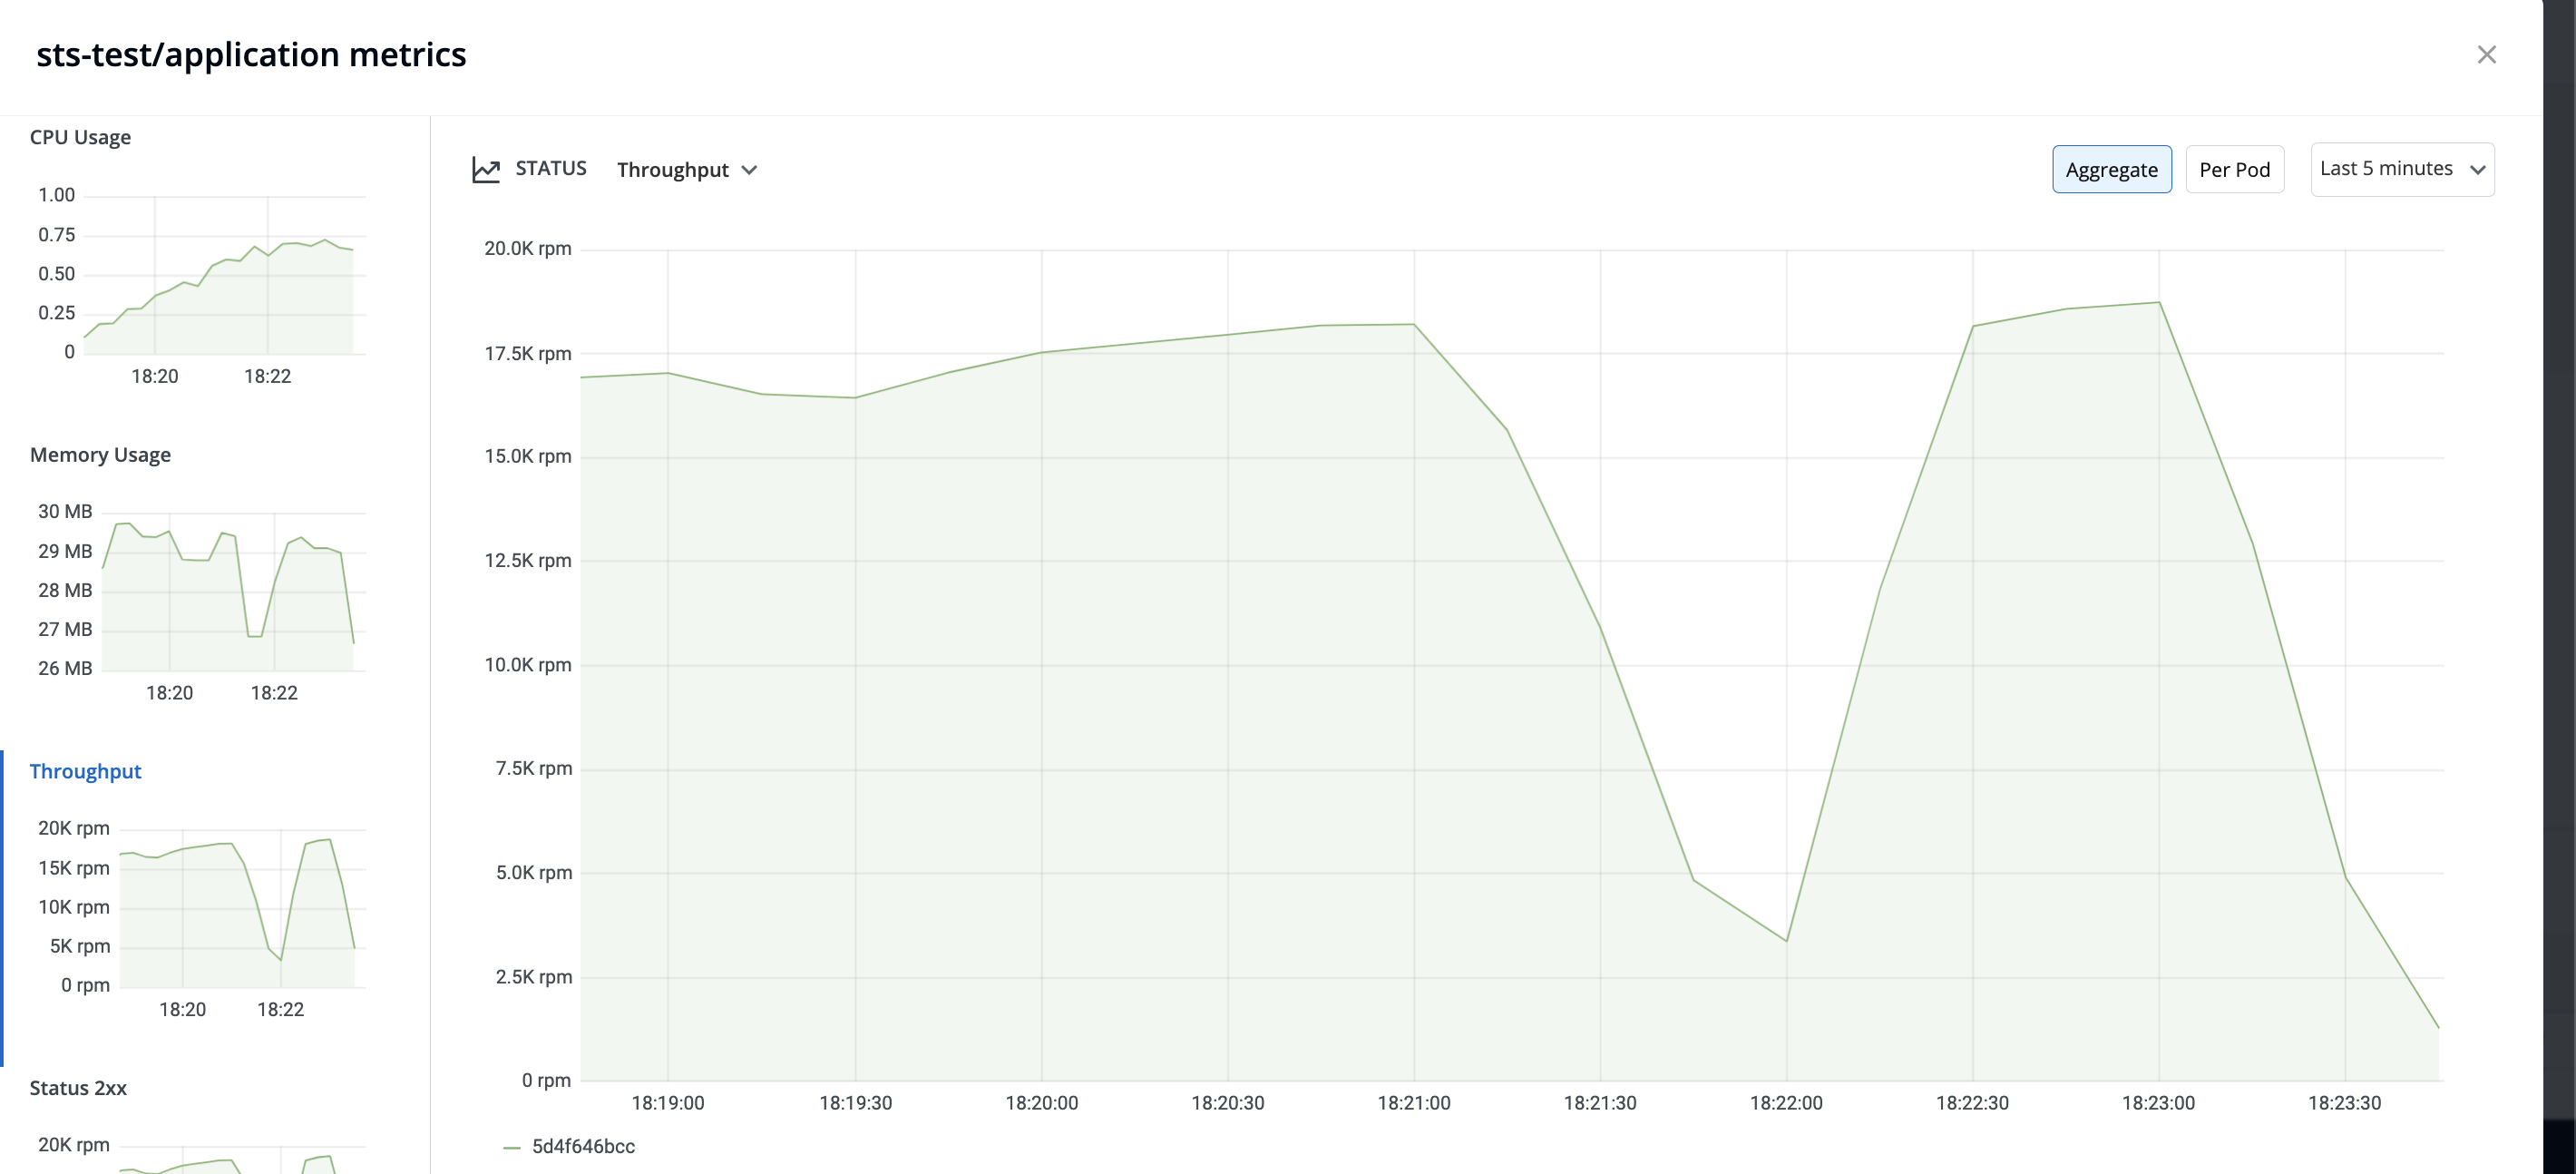
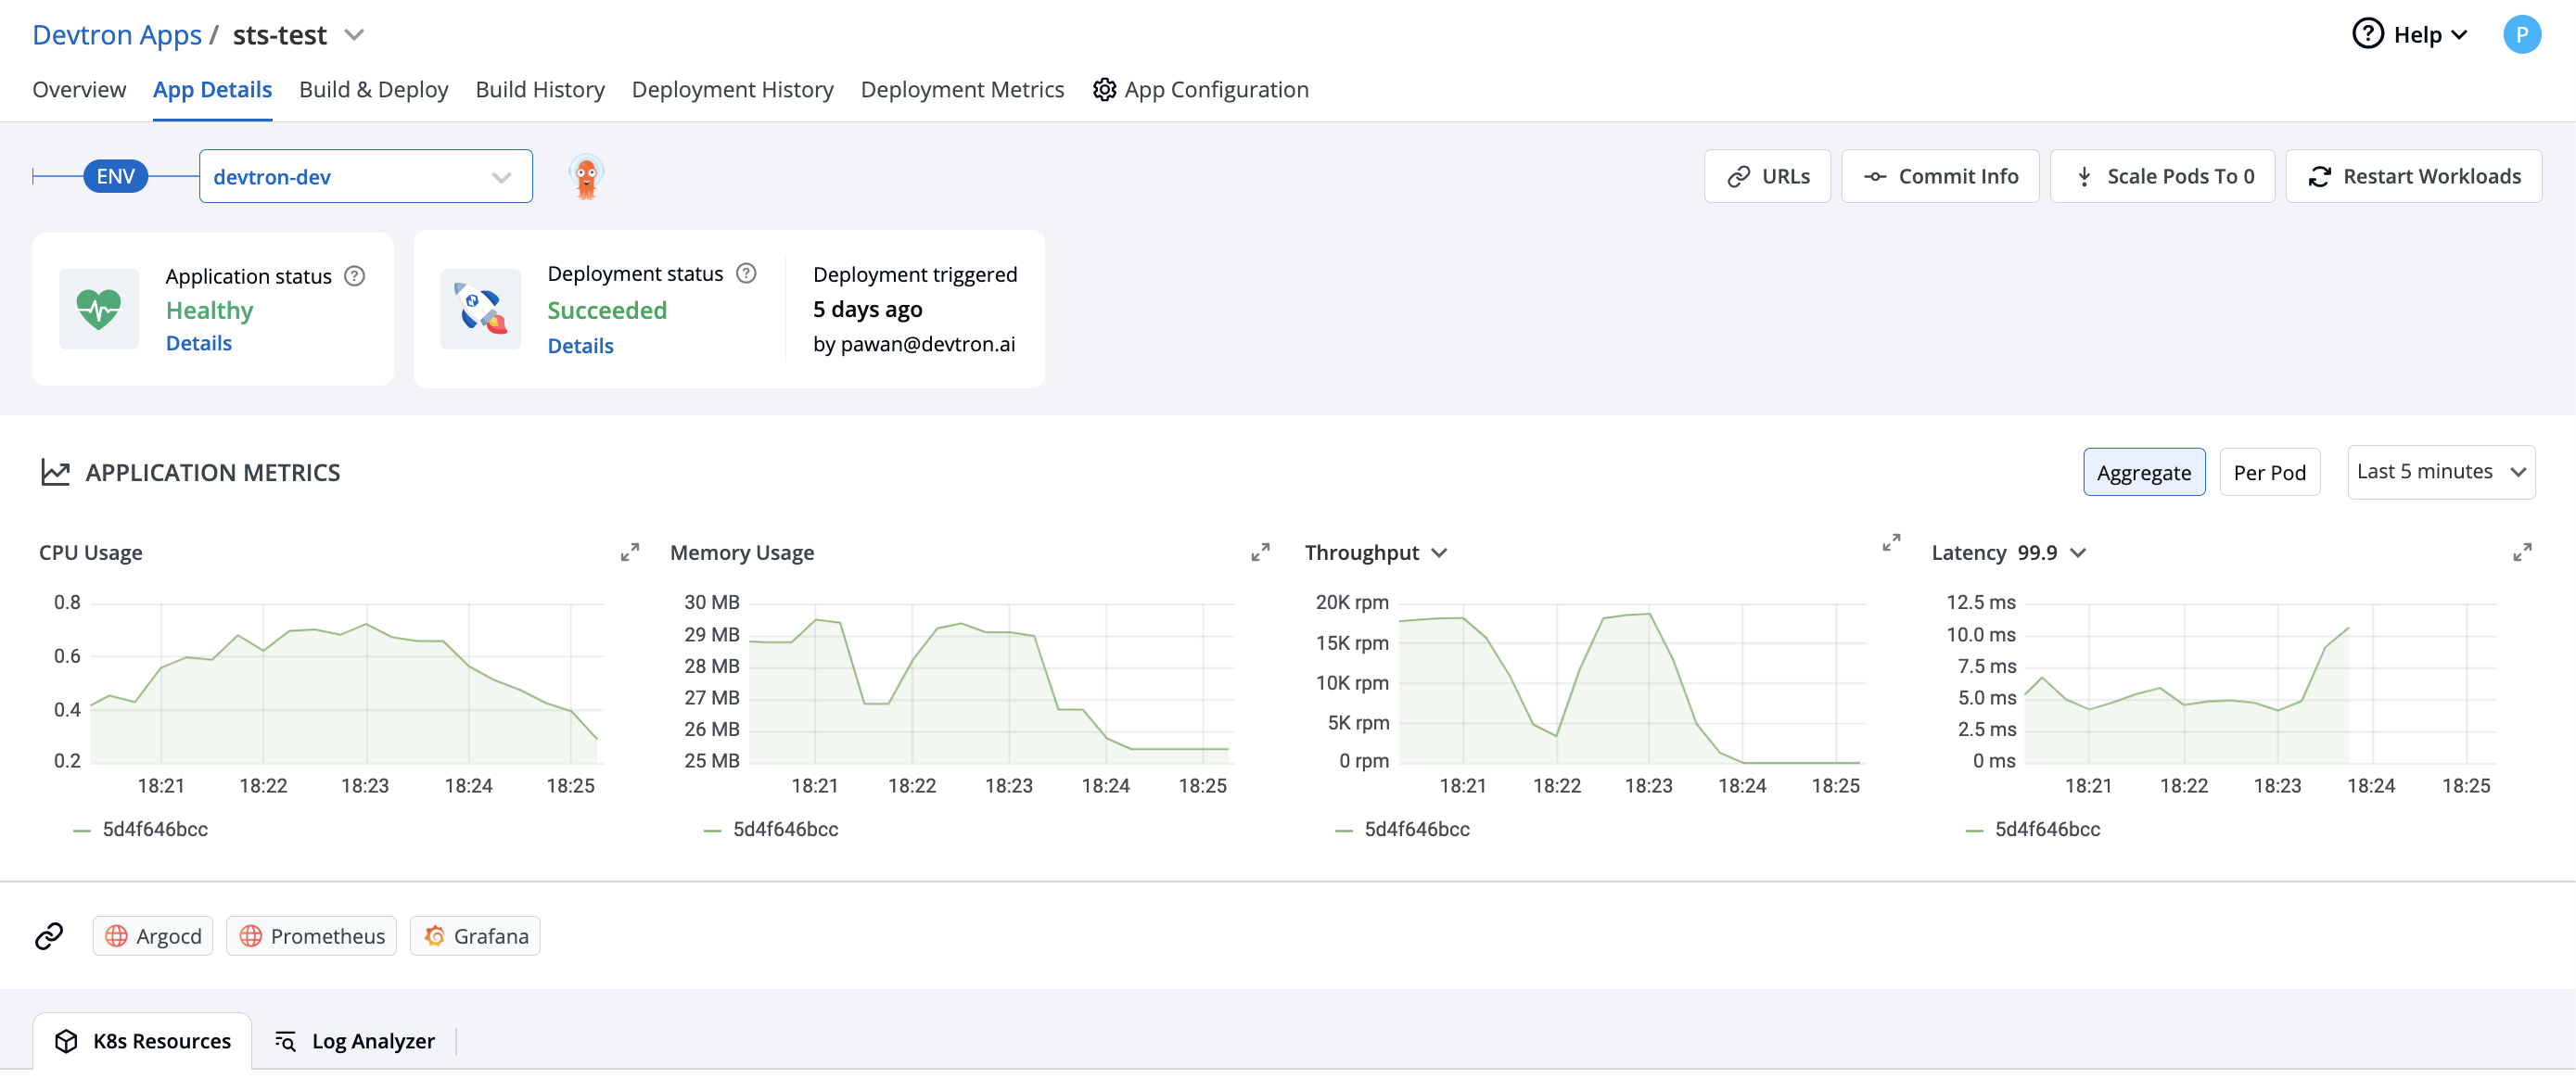
The devtron-app-throughput dashboard uses the prometheus data source to create a Grafana dashboard with the graph panel.
Data source config
Collector type:
Collector plugins:
Collector config:
Revisions
Upload an updated version of an exported dashboard.json file from Grafana
| Revision | Description | Created | |
|---|---|---|---|
| Download |