Prometheus Metrics Management
Inspect the cardinality of your Prometheus metrics
Cardinality is key. And it’s easy to get it out of control. Inspect your metrics with simple Prometheus queries and tune your instrumentation.
See more at https://mkaz.me/blog/2023/simple-prometheus-queries-for-metrics-inspection/
Installing
To import this dashboard, enter the ID 19341 in the Dashboards > New > Import form. For more details, visit Import dashboards
Dashboard Structure
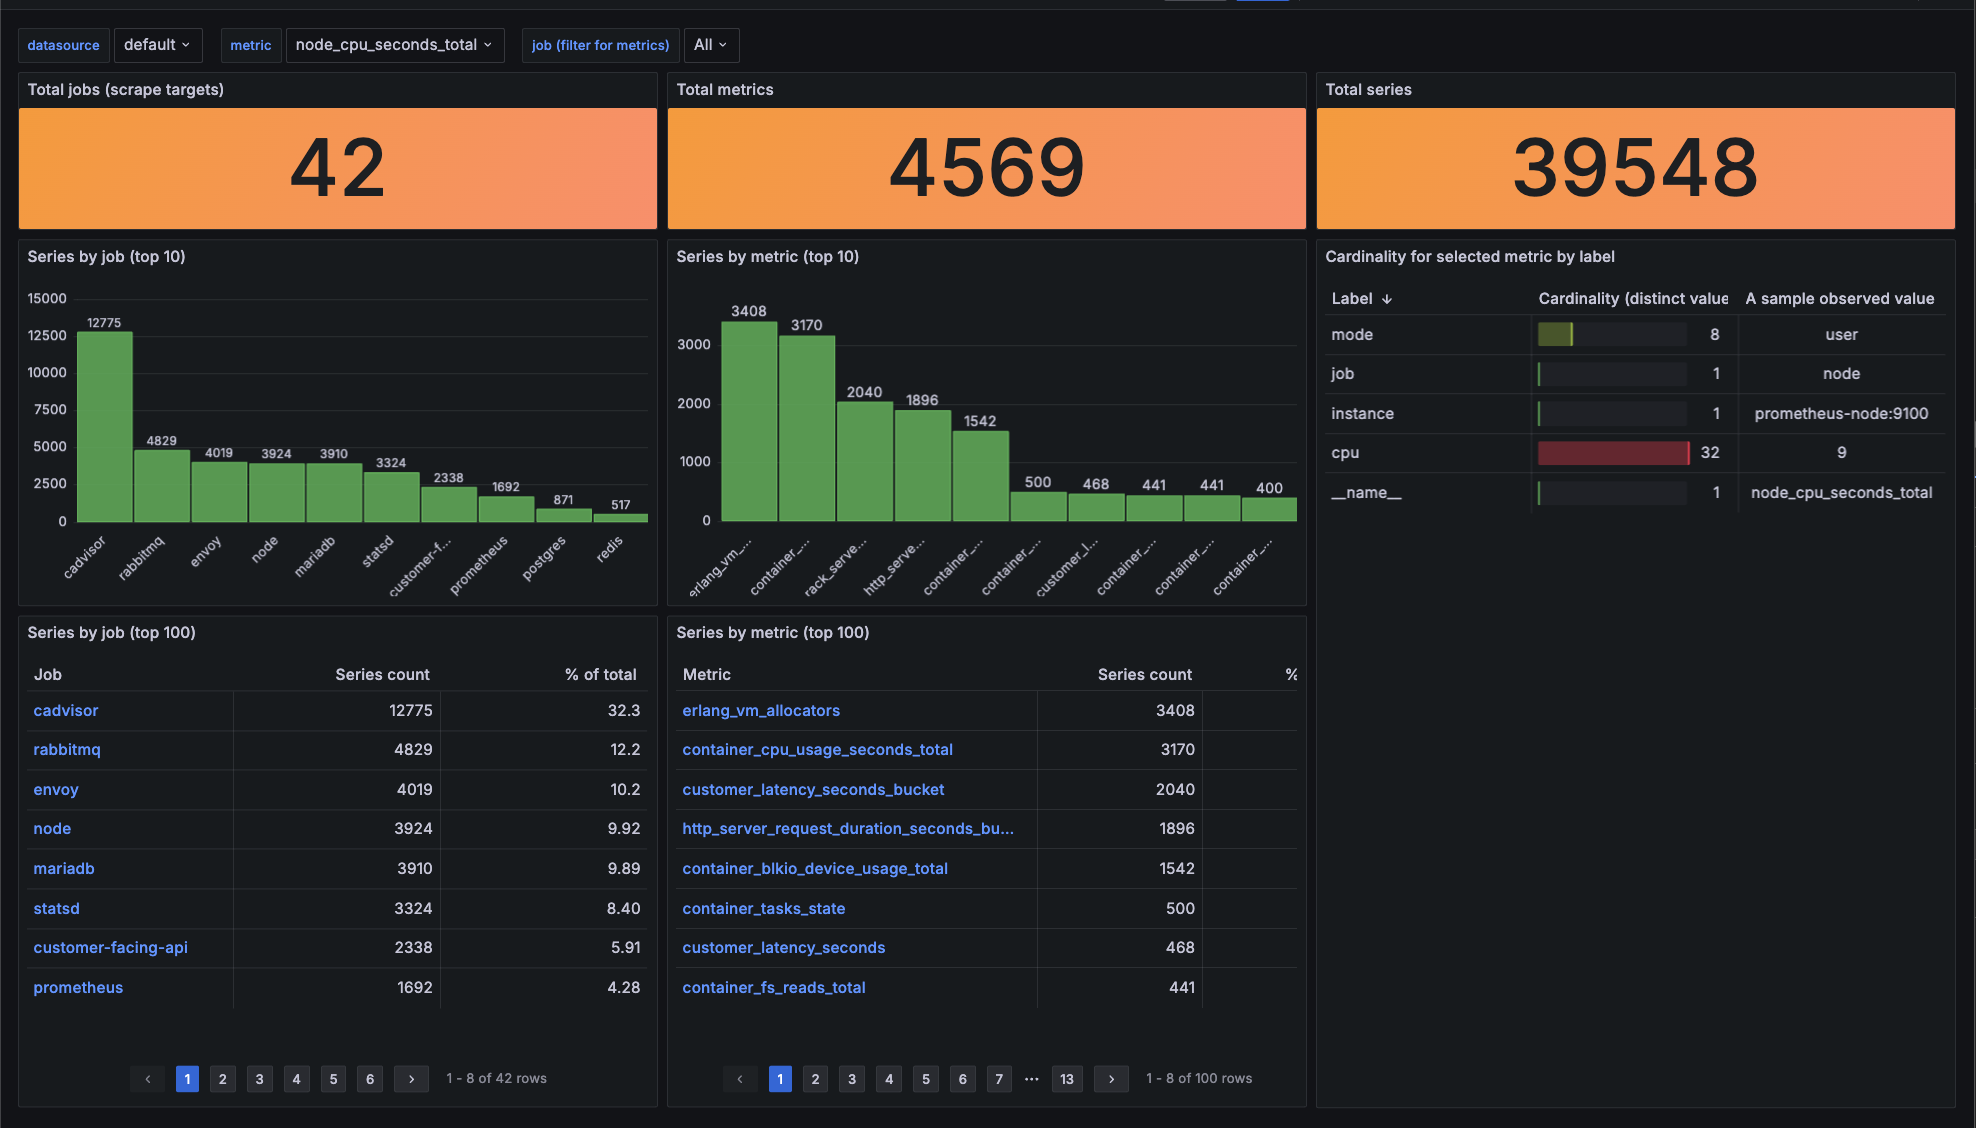
The dashboard displays three key statistics and three tables (with histograms), each providing different perspectives on cardinality.
Total Jobs
This statistic shows the number of jobs (scrape targets) that produce metrics.
Total Metrics
This statistic shows the number of all metrics. In other words, it's the number of unique __name__ values. __name__ is a special label that stands for the metric name.
Total Series
This statistic shows the number of all observed label combinations, representing the total time series managed by Prometheus.
Series by job table
This table shows the number of time series observed per job (scrape target).
Series by metric table
This table displays the number of unique label combinations observed per metric, useful for spotting metrics with high cardinality labels.
Cardinality by label for selected metric table
This table breaks down the selected metric by its labels, helping you identify which labels have high cardinality.
Data source config
Collector config:
Upload an updated version of an exported dashboard.json file from Grafana
| Revision | Description | Created | |
|---|---|---|---|
| Download |
Metrics Endpoint (Prometheus)
Easily monitor any Prometheus-compatible and publicly accessible metrics URL with Grafana Cloud's out-of-the-box monitoring solution.
Learn more