WELL Cloudwatch Logs
A simple Amazon Cloudwatch logs dashboard. It allow filtering by log groups, and quick searches of any terms to filter the log lines.
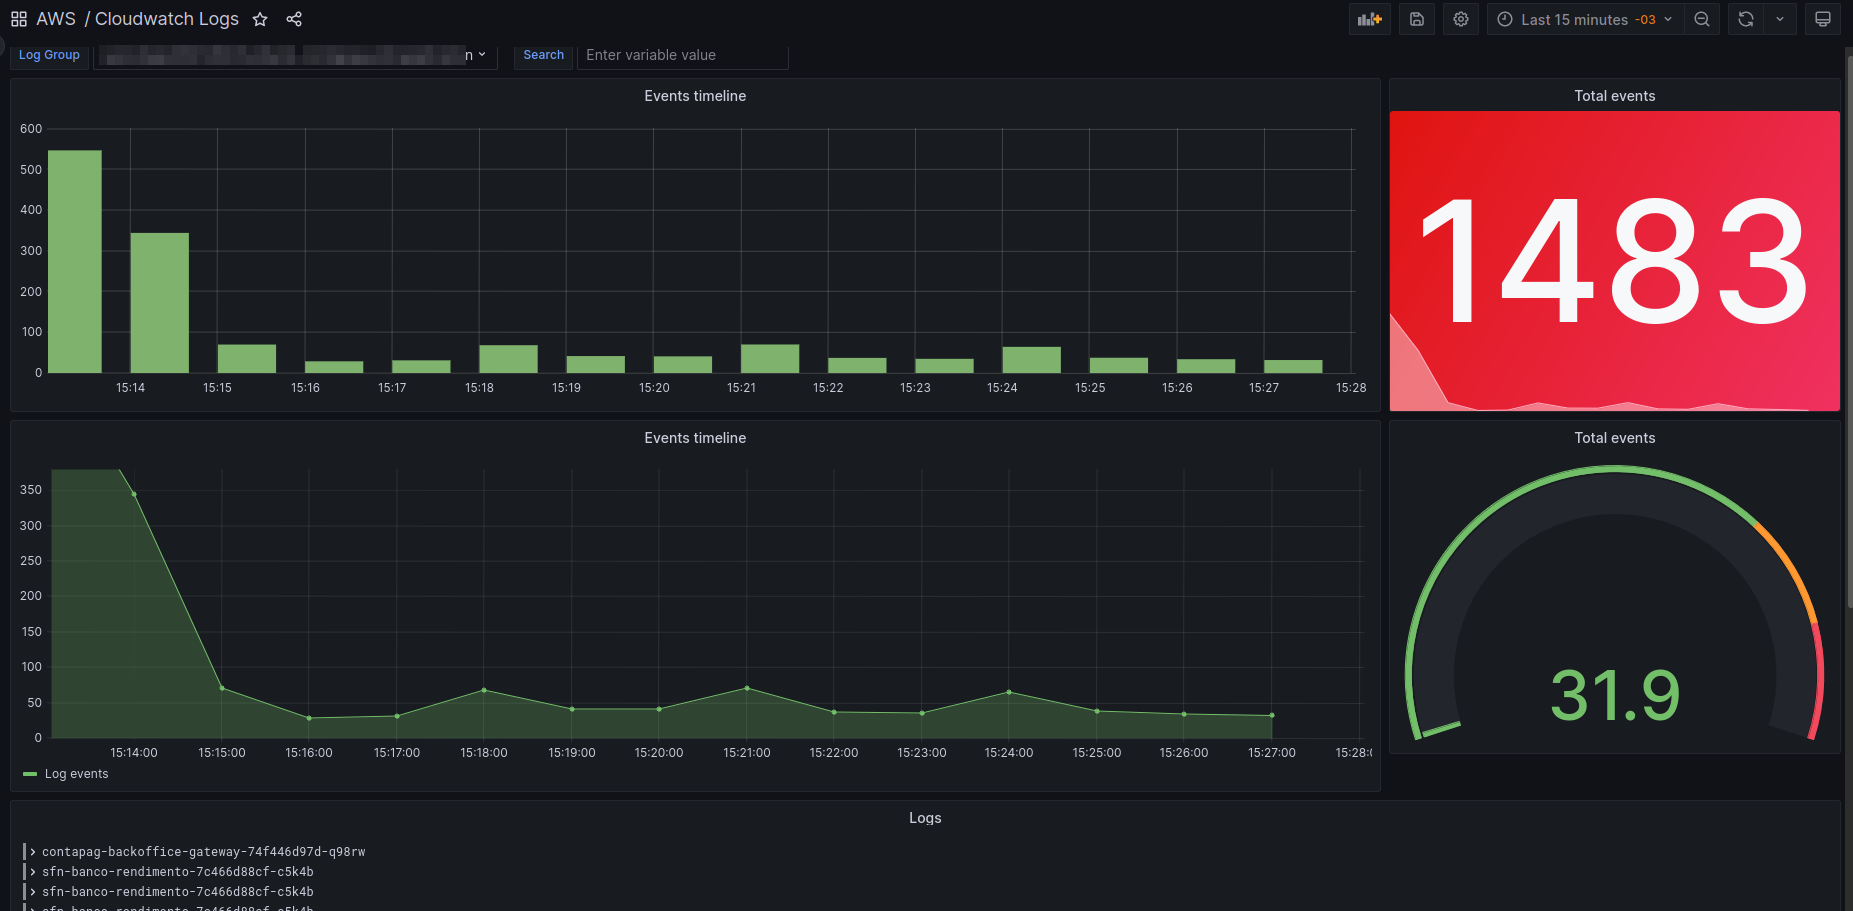
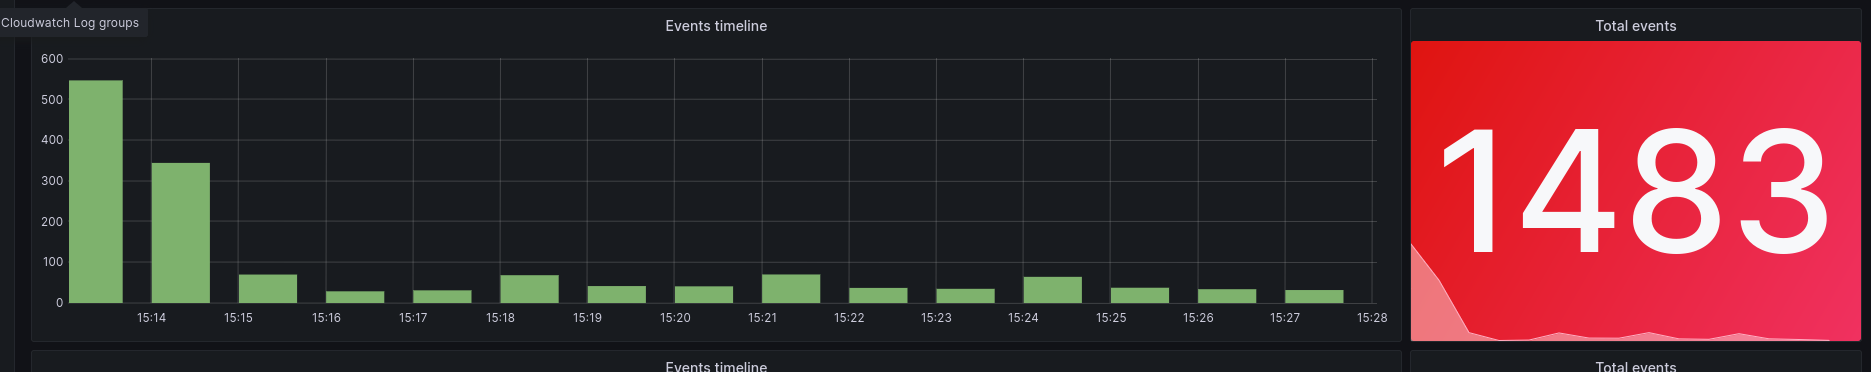
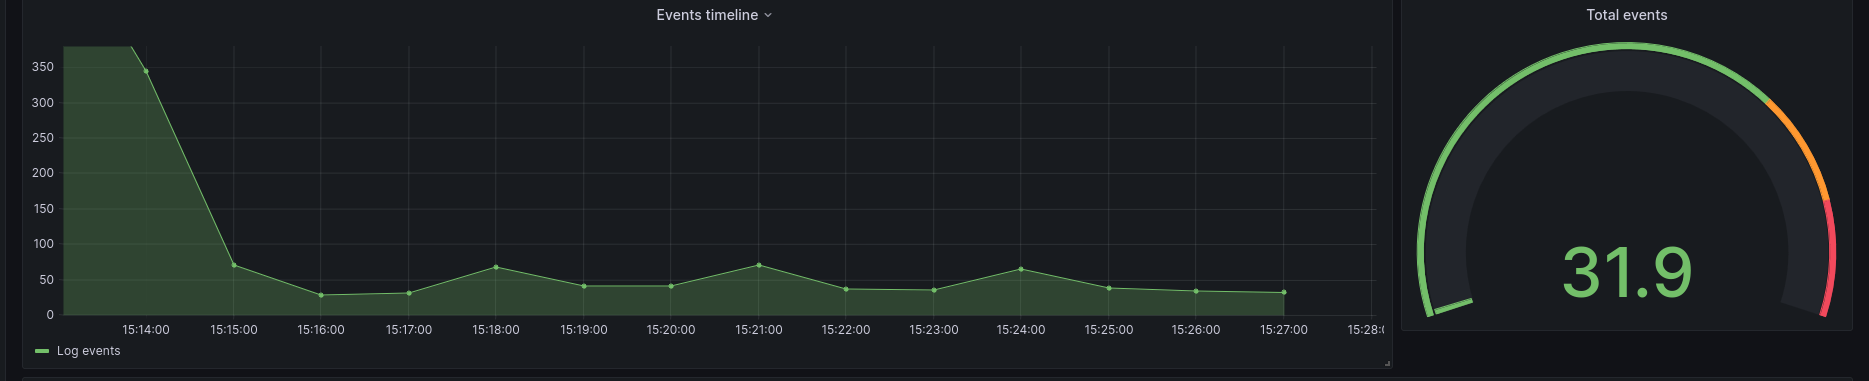
The WELL Cloudwatch Logs dashboard uses the cloudwatch data source to create a Grafana dashboard with the gauge, graph, logs, stat and timeseries panels.
Data source config
Collector type:
Collector plugins:
Collector config:
Revisions
Upload an updated version of an exported dashboard.json file from Grafana
| Revision | Description | Created | |
|---|---|---|---|
| Download |
Grafana Loki (self-hosted)
Easily monitor Grafana Loki (self-hosted), a horizontally scalable, highly available, multi-tenant log aggregation system inspired by Prometheus, with Grafana Cloud's out-of-the-box monitoring solution.
Learn more