Docker monitoring
Docker monitoring with Prometheus and cAdvisor
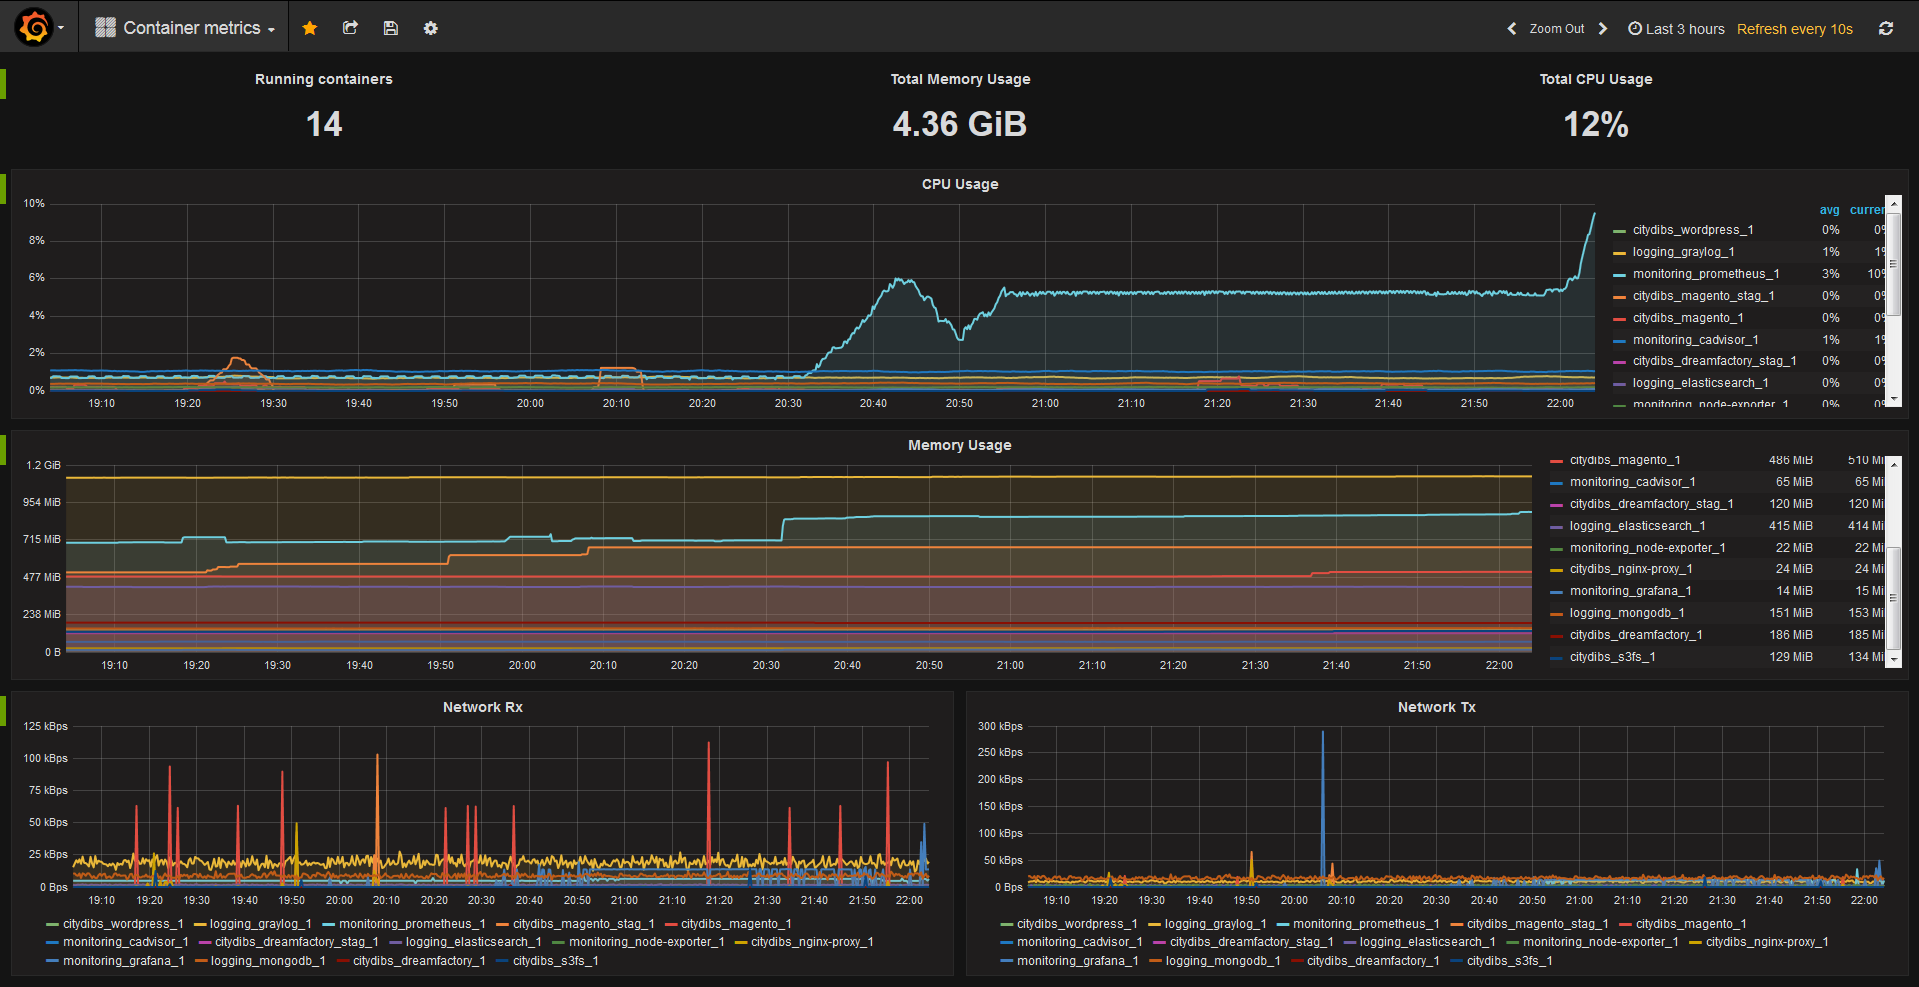
This is a dashboard for monitoring Docker container metrics collected by cAdvisor and stored in Prometheus TSDB.
Its an alternative for Brians Docker dashboard with some variations and not based on the Kubernetes Dashboard.
For monitoring the host system, I suggest using node-exporter dashboard along this one.
If you have any suggestions or want to contribute, check https://github.com/philicious/grafana-dashboards
Data source config
Collector type:
Collector plugins:
Collector config:
Revisions
Upload an updated version of an exported dashboard.json file from Grafana
| Revision | Description | Created | |
|---|---|---|---|
| Download |
Docker
Easily monitor Docker with Grafana Cloud's out-of-the-box monitoring solution.
Learn more