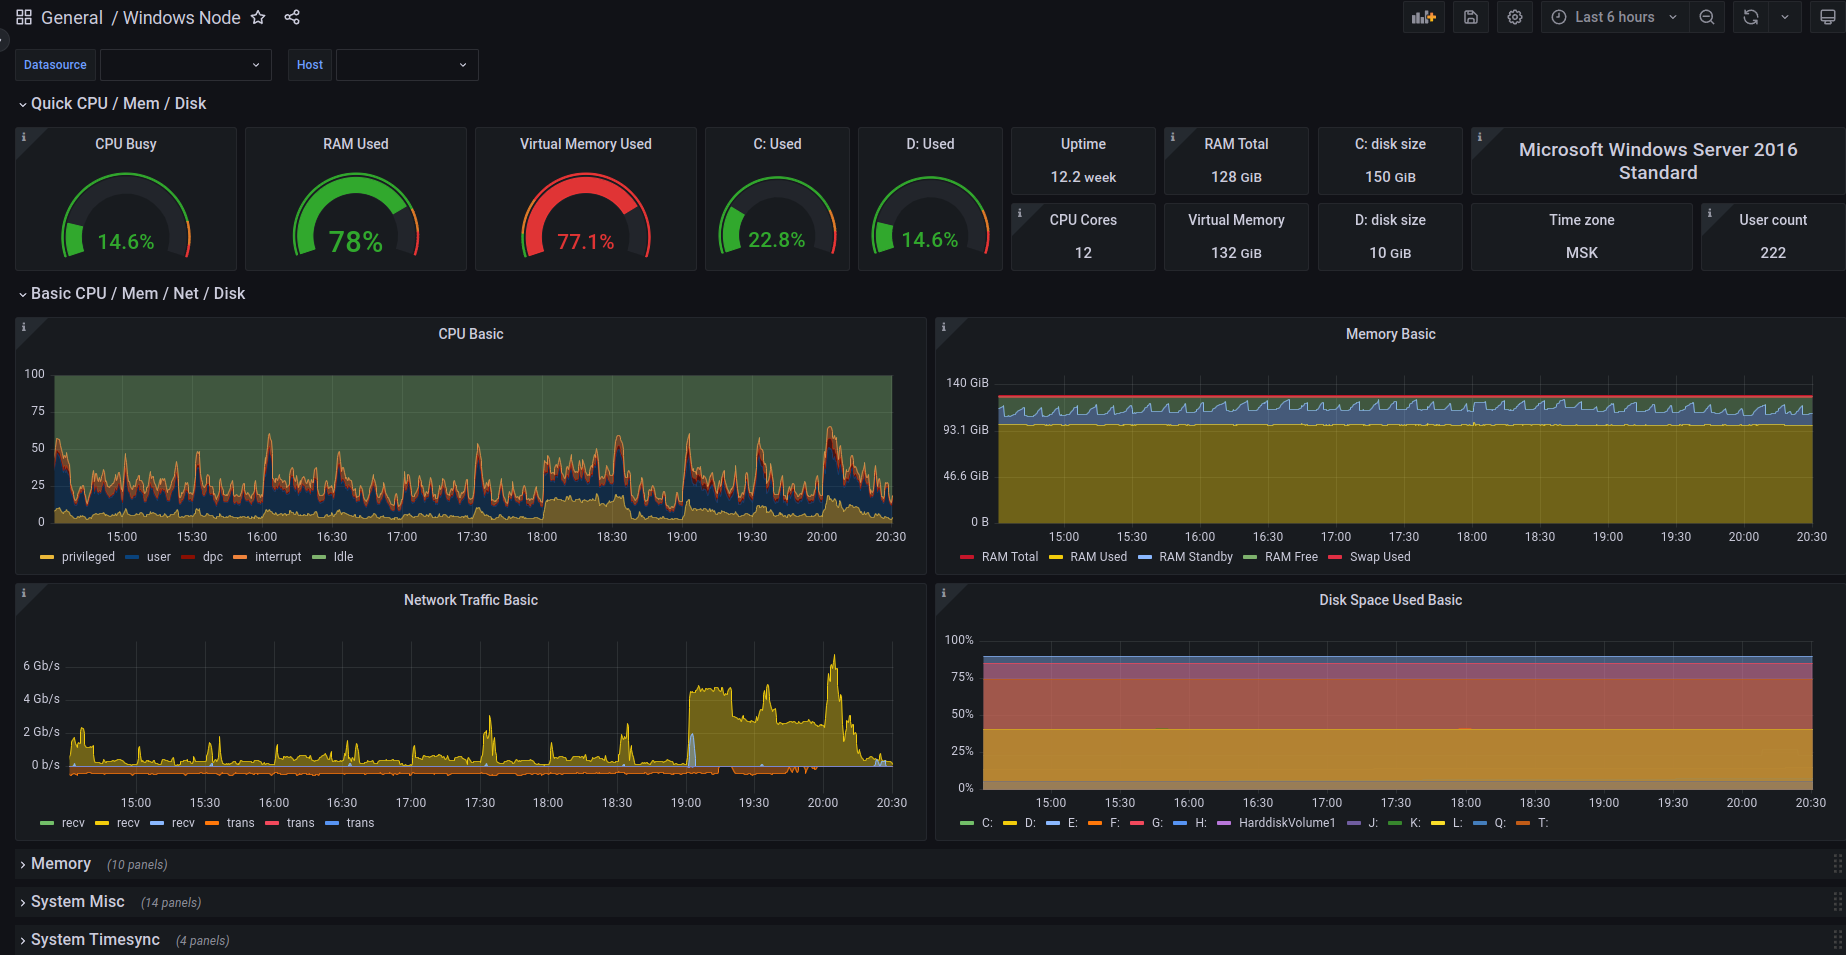
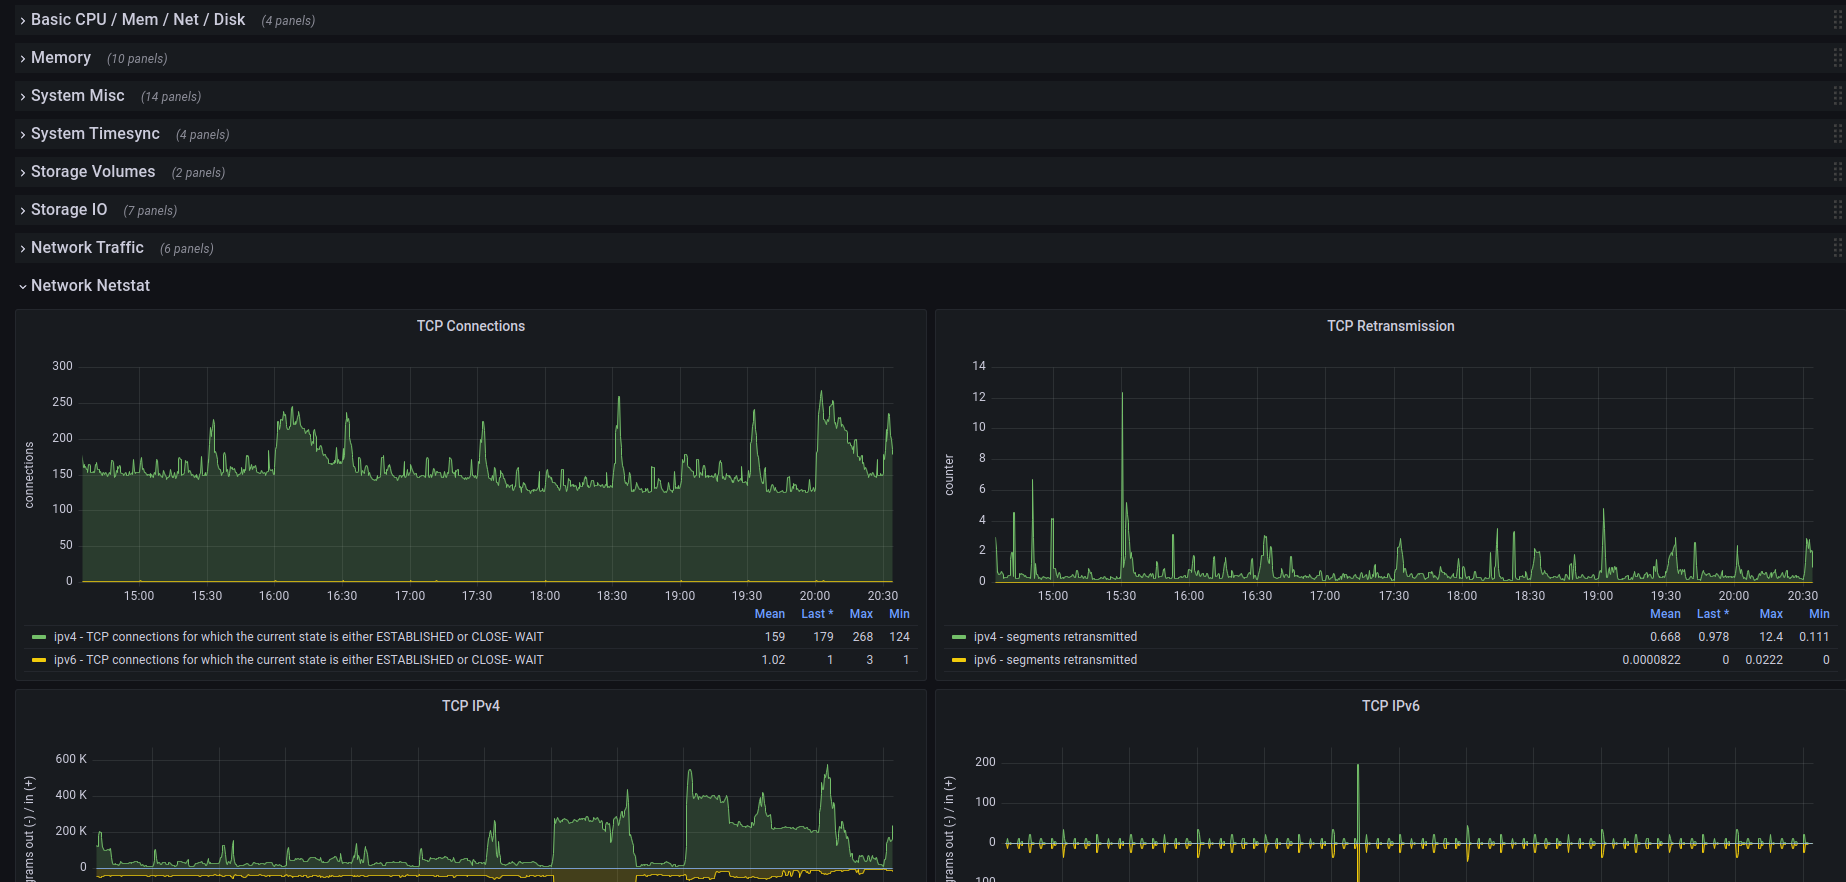
Windows Node All
Windows Exporter metrics
This dashboards includes panels for almost all internal Prometheus metrics.
Tested on Prometheus 2.44.0
Source code is available on https://github.com/Raiffeisen-DGTL/observability
This dashboard includes panels with lots of metrics collected by Window Exporter. It is largely influenced by Node Exporter Full dashboard and tries to create a unified approach for observing host metrics for both Linux and Windows.
Tested on windows-exporter v. 0.20.0 with the following collectors enabled:
- cpu
- cs
- logical_disk
- memory
- net
- os
- system
- tcp
- time
Source code is available on https://github.com/Raiffeisen-DGTL/observability
Data source config
Collector config:
Upload an updated version of an exported dashboard.json file from Grafana
| Revision | Description | Created | |
|---|---|---|---|
| Download |
Linux Server
Monitor Linux with Grafana. Easily monitor your Linux deployment with Grafana Cloud's out-of-the-box monitoring solution.
Learn more
